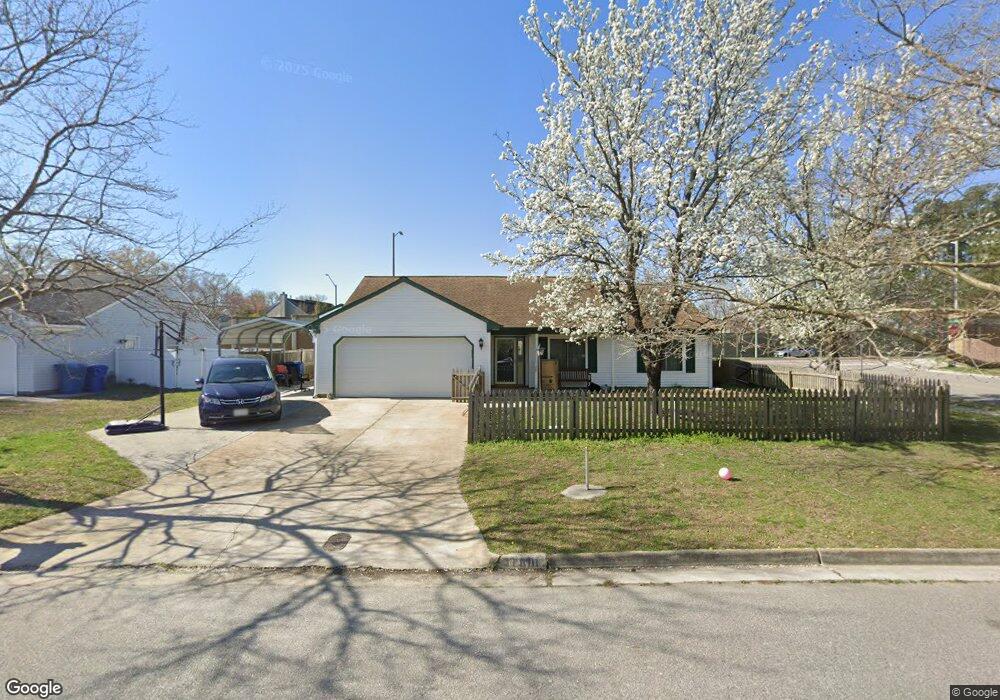
1801 Maple Shade Ct Virginia Beach, VA 23453
Dam Neck NeighborhoodEstimated Value: $414,000 - $430,000
3
Beds
2
Baths
1,308
Sq Ft
$322/Sq Ft
Est. Value
About This Home
This home is located at 1801 Maple Shade Ct, Virginia Beach, VA 23453 and is currently estimated at $421,207, approximately $322 per square foot. 1801 Maple Shade Ct is a home located in Virginia Beach City with nearby schools including Christopher Farms Elementary School, Princess Anne Middle School, and Floyd E. Kellam High School.
Ownership History
Date
Name
Owned For
Owner Type
Purchase Details
Closed on
Aug 12, 2020
Sold by
Kapp Roy J and Kapp Sharon K
Bought by
Sanders Timothy E and Sanders Leighann Offerman
Current Estimated Value
Home Financials for this Owner
Home Financials are based on the most recent Mortgage that was taken out on this home.
Original Mortgage
$281,325
Outstanding Balance
$249,555
Interest Rate
3%
Mortgage Type
New Conventional
Estimated Equity
$171,652
Purchase Details
Closed on
Jan 30, 2004
Sold by
Shatarah Jack
Bought by
Clark John
Home Financials for this Owner
Home Financials are based on the most recent Mortgage that was taken out on this home.
Original Mortgage
$157,016
Interest Rate
5.82%
Mortgage Type
VA
Purchase Details
Closed on
Aug 14, 2001
Sold by
Graves James R
Bought by
Shatarah Jack
Home Financials for this Owner
Home Financials are based on the most recent Mortgage that was taken out on this home.
Original Mortgage
$130,965
Interest Rate
6.98%
Create a Home Valuation Report for This Property
The Home Valuation Report is an in-depth analysis detailing your home's value as well as a comparison with similar homes in the area
Home Values in the Area
Average Home Value in this Area
Purchase History
| Date | Buyer | Sale Price | Title Company |
|---|---|---|---|
| Sanders Timothy E | $275,000 | Old Republic Natl Ttl Ins Co | |
| Clark John | $152,000 | -- | |
| Shatarah Jack | $132,000 | -- |
Source: Public Records
Mortgage History
| Date | Status | Borrower | Loan Amount |
|---|---|---|---|
| Open | Sanders Timothy E | $281,325 | |
| Previous Owner | Clark John | $157,016 | |
| Previous Owner | Shatarah Jack | $130,965 |
Source: Public Records
Tax History Compared to Growth
Tax History
| Year | Tax Paid | Tax Assessment Tax Assessment Total Assessment is a certain percentage of the fair market value that is determined by local assessors to be the total taxable value of land and additions on the property. | Land | Improvement |
|---|---|---|---|---|
| 2025 | $3,476 | $367,300 | $165,000 | $202,300 |
| 2024 | $3,476 | $358,300 | $152,000 | $206,300 |
| 2023 | $3,299 | $333,200 | $136,000 | $197,200 |
| 2022 | $2,929 | $102,000 | $0 | $102,000 |
| 2021 | $2,458 | $272,100 | $103,000 | $169,100 |
| 2020 | $2,480 | $243,700 | $103,000 | $140,700 |
| 2019 | $2,479 | $241,300 | $102,000 | $139,300 |
| 2018 | $2,419 | $241,300 | $102,000 | $139,300 |
| 2017 | $2,399 | $239,300 | $100,000 | $139,300 |
| 2016 | $2,328 | $235,200 | $100,000 | $135,200 |
| 2015 | $2,253 | $227,600 | $95,000 | $132,600 |
| 2014 | $2,013 | $223,800 | $97,500 | $126,300 |
Source: Public Records
Map
Nearby Homes
- 1909 Maple Shade Dr
- 2812 Pleasant Acres Dr
- 1809 Chestwood Dr
- 2748 Christopher Farms Dr
- 1729 Chestwood Dr
- 1713 Lapstone Ct
- 2921 Bluegrass Ln
- 2604 Saint Regis Ln
- 2946 Sugar Maple Dr
- 2020 Aloma Dr
- 1909 Dannemora Dr
- 2624 Rochambeau Way
- 2413 Dunning Arch
- 2605 Killey Ct
- 2505 Shea Cir
- 2516 Placid Place
- 2308 Holland Rd
- 2537 Springhaven Dr
- 2569 Springhaven Dr
- 3104 Bloomfield Ct
- 1805 Maple Shade Ct
- 2601 Wild Cherry Ct
- 1812 Maple Shade Ct
- 1809 Maple Shade Ct
- 2128 Broadacres Ct
- 1908 Maple Shade Dr
- 1913 Maple Shade Dr
- 2605 Wild Cherry Ct
- 2601 Broadacres Way
- 1824 Maple Shade Ct
- 1916 Maple Shade Dr
- 1917 Maple Shade Dr
- 2129 Broadacres Ct
- 2129 Broadacres Ct Unit Ct
- 2609 Wild Cherry Ct
- 2124 Broadacres Ct
- 1817 Maple Shade Ct
- 1828 Maple Shade Ct
- 2608 Wild Cherry Ct
- 2605 Broadacres Way