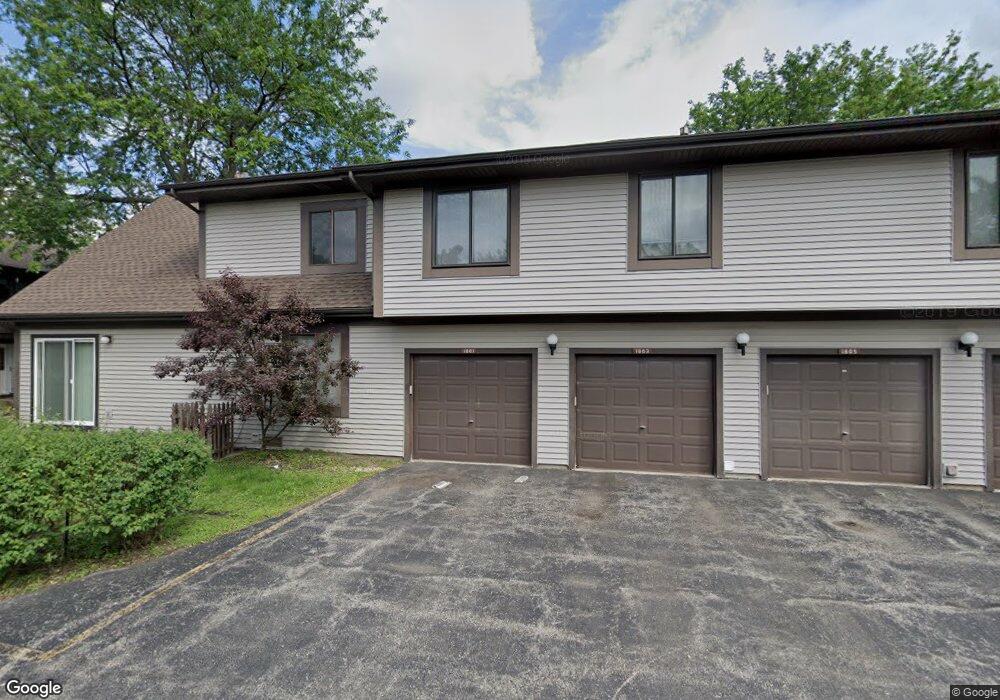
1801 Raintree Ct Unit 6 Sycamore, IL 60178
Estimated Value: $184,796 - $196,000
4
Beds
2
Baths
1,080
Sq Ft
$175/Sq Ft
Est. Value
About This Home
This home is located at 1801 Raintree Ct Unit 6, Sycamore, IL 60178 and is currently estimated at $188,699, approximately $174 per square foot. 1801 Raintree Ct Unit 6 is a home located in DeKalb County with nearby schools including Sycamore High School, Cornerstone Christian Academy, and St Mary's Catholic School.
Ownership History
Date
Name
Owned For
Owner Type
Purchase Details
Closed on
Feb 1, 2023
Sold by
Payton Matthew L and Payton Erica
Bought by
Stafford Theresa Michelle and Damhoff Ryan Mathew
Current Estimated Value
Home Financials for this Owner
Home Financials are based on the most recent Mortgage that was taken out on this home.
Original Mortgage
$127,500
Outstanding Balance
$123,441
Interest Rate
6.25%
Mortgage Type
New Conventional
Estimated Equity
$65,258
Purchase Details
Closed on
Aug 23, 2019
Sold by
Hollinshead Kashia and Estate Of Stacia Hollinshead
Bought by
Payton Matthew L
Home Financials for this Owner
Home Financials are based on the most recent Mortgage that was taken out on this home.
Original Mortgage
$93,279
Interest Rate
4.37%
Mortgage Type
FHA
Purchase Details
Closed on
Sep 21, 2018
Sold by
Beckley Charles M and Applehoff Karen E
Bought by
Hollinshead Stacia
Create a Home Valuation Report for This Property
The Home Valuation Report is an in-depth analysis detailing your home's value as well as a comparison with similar homes in the area
Home Values in the Area
Average Home Value in this Area
Purchase History
| Date | Buyer | Sale Price | Title Company |
|---|---|---|---|
| Stafford Theresa Michelle | $150,000 | Chicago Title | |
| Payton Matthew L | $95,000 | Fidelity National Title | |
| Hollinshead Stacia | $108,000 | Attorney |
Source: Public Records
Mortgage History
| Date | Status | Borrower | Loan Amount |
|---|---|---|---|
| Open | Stafford Theresa Michelle | $127,500 | |
| Previous Owner | Payton Matthew L | $93,279 |
Source: Public Records
Tax History Compared to Growth
Tax History
| Year | Tax Paid | Tax Assessment Tax Assessment Total Assessment is a certain percentage of the fair market value that is determined by local assessors to be the total taxable value of land and additions on the property. | Land | Improvement |
|---|---|---|---|---|
| 2024 | $3,488 | $52,145 | $5,961 | $46,184 |
| 2023 | $3,488 | $45,055 | $5,577 | $39,478 |
| 2022 | $3,460 | $43,000 | $5,323 | $37,677 |
| 2021 | $3,327 | $40,941 | $5,068 | $35,873 |
| 2020 | $3,818 | $39,578 | $4,910 | $34,668 |
| 2019 | $2,553 | $32,239 | $4,704 | $27,535 |
| 2018 | $3,020 | $30,489 | $4,449 | $26,040 |
| 2017 | $2,931 | $29,027 | $4,236 | $24,791 |
| 2016 | $2,830 | $27,281 | $3,981 | $23,300 |
| 2015 | -- | $25,618 | $3,738 | $21,880 |
| 2014 | -- | $24,657 | $3,598 | $21,059 |
| 2013 | -- | $25,551 | $3,728 | $21,823 |
Source: Public Records
Map
Nearby Homes
- 1729 Raintree Ct Unit 92
- 1721 Cedarbrook Ct Unit 1
- Lots 1 & 2 Dekalb Ave
- Lots 700-900 Ridge Dr
- 2123 Fairland Dr
- 0000 Coltonville Rd
- 1235 Hathaway Dr
- 1606 E Stonehenge Dr
- 625 Anjali Ct Unit L
- 617 Anjali Ct
- 610 Anjali Ct Unit R
- 1208 Foxpointe Dr
- 608 Anjali Ct Unit L
- 932 Foxpointe Dr
- 505 Anjali Ct
- Lot 4 W Prairie Dr
- 419 Anjali Ct Unit R
- Lot 7 Aberdeen Ct
- Lot 104 Aberdeen Ct
- 404 Anjali Ct Unit L
- 1801 Raintree Ct Unit 61
- 1803 Raintree Ct Unit 62
- 1805 Raintree Ct Unit 63
- 1807 Raintree Ct Unit 64
- 1737 Raintree Ct Unit 102
- 1741 Raintree Ct Unit 104
- 1735 Raintree Ct Unit 101
- 1733 Raintree Ct Unit 94
- 1731 Raintree Ct Unit 93
- 1731 Raintree Ct Unit 1731
- 1727 Raintree Ct Unit 91
- 1809 Raintree Ct Unit 51
- 1811 Raintree Ct Unit 52
- 1813 Raintree Ct Unit 53
- 1815 Raintree Ct Unit 54
- 1802 Raintree Ct Unit 41
- 1804 Raintree Ct Unit 42
- 1806 Raintree Ct Unit 43
- 1810 Raintree Ct Unit 31
- 1808 Raintree Ct Unit 44