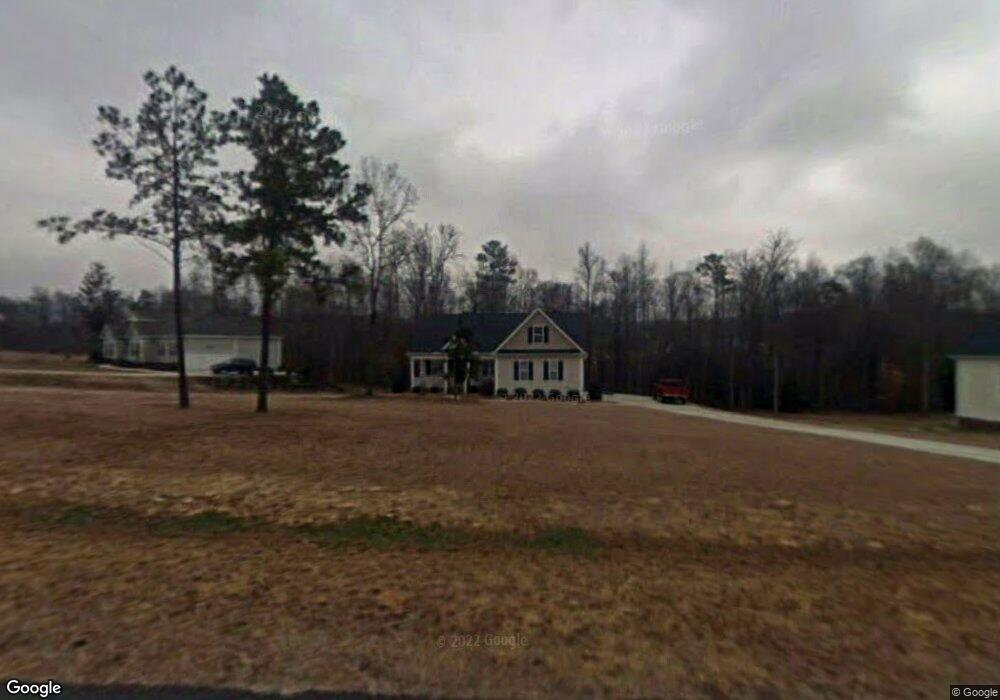
1801 Shell Cracker Dr Willow Spring, NC 27592
Estimated Value: $419,448 - $442,000
Studio
3
Baths
2,246
Sq Ft
$193/Sq Ft
Est. Value
About This Home
This home is located at 1801 Shell Cracker Dr, Willow Spring, NC 27592 and is currently estimated at $434,483, approximately $193 per square foot. 1801 Shell Cracker Dr is a home located in Wake County with nearby schools including Willow Springs Elementary School.
Ownership History
Date
Name
Owned For
Owner Type
Purchase Details
Closed on
Oct 13, 2005
Sold by
Kingsley Adam M and Kingsley Juliana T Driessen
Bought by
Kingsley Adam M and Kingsley Juliana T Driessen
Current Estimated Value
Purchase Details
Closed on
Aug 4, 2005
Sold by
Raynor Builders Inc
Bought by
Kingsley Adam M and Driessen Juliana T
Home Financials for this Owner
Home Financials are based on the most recent Mortgage that was taken out on this home.
Original Mortgage
$148,125
Outstanding Balance
$77,061
Interest Rate
5.51%
Mortgage Type
Fannie Mae Freddie Mac
Estimated Equity
$357,422
Purchase Details
Closed on
Apr 19, 2005
Sold by
Tar Heel Developers Inc
Bought by
Raynor Builders Inc
Home Financials for this Owner
Home Financials are based on the most recent Mortgage that was taken out on this home.
Original Mortgage
$25,000
Interest Rate
5.79%
Mortgage Type
Purchase Money Mortgage
Create a Home Valuation Report for This Property
The Home Valuation Report is an in-depth analysis detailing your home's value as well as a comparison with similar homes in the area
Home Values in the Area
Average Home Value in this Area
Purchase History
| Date | Buyer | Sale Price | Title Company |
|---|---|---|---|
| Kingsley Adam M | -- | None Available | |
| Kingsley Adam M | $185,000 | None Available | |
| Raynor Builders Inc | $32,000 | -- |
Source: Public Records
Mortgage History
| Date | Status | Borrower | Loan Amount |
|---|---|---|---|
| Open | Kingsley Adam M | $148,125 | |
| Closed | Kingsley Adam M | $27,750 | |
| Previous Owner | Raynor Builders Inc | $25,000 |
Source: Public Records
Tax History
| Year | Tax Paid | Tax Assessment Tax Assessment Total Assessment is a certain percentage of the fair market value that is determined by local assessors to be the total taxable value of land and additions on the property. | Land | Improvement |
|---|---|---|---|---|
| 2025 | $2,649 | $411,089 | $90,000 | $321,089 |
| 2024 | $2,573 | $411,089 | $90,000 | $321,089 |
Source: Public Records
Map
Nearby Homes
- 1617 Kendall Hill Rd
- 7218 Cabernet Franc Dr
- 1962 Dapple Dr
- 7308 Messenger Dr
- 1401 Justin Oaks Ct
- 5215 Red Crimson Dr
- 2416 Eddie Howard Rd
- 7301 Ladora Dr
- 7101 Numa Cir
- 2416 Whitset Place
- 8324 Yellow Aster Ct
- 0 Turner Fish Rd Unit 10130690
- 8120 Purple Aster Dr
- 8340 Cannon Grove Dr
- 8316 Running Fern Way
- 2928 Denson Rd
- 1305 White Spruce Dr
- 1133 Farmers Branch Rd
- 3748 Norman Blalock Rd
- 1000 Creek Front Ct
- 1733 Shell Cracker Dr
- 1805 Shell Cracker Dr
- 1024 Shellfish Dr
- 1804 Shell Cracker Dr
- 1729 Shell Cracker Dr
- 1020 Shellfish Dr
- 1017 Shellfish Dr
- 1736 Shell Cracker Dr
- 1809 Shell Cracker Dr
- 7300 Sarahwood Ct
- 1732 Shell Cracker Dr
- 1725 Shell Cracker Dr
- 1813 Shell Cracker Dr
- 1016 Shellfish Dr
- 7308 Sarahwood Ct
- 1728 Shell Cracker Dr
- 1012 Shellfish Dr
- 1709 Starfish Ct
- 1705 Starfish Ct
- 1721 Shell Cracker Dr
Your Personal Tour Guide
Ask me questions while you tour the home.