1801 Skycrest Dr Unit 6 Walnut Creek, CA 94595
Rossmoor NeighborhoodEstimated Value: $601,000 - $759,000
2
Beds
2
Baths
1,406
Sq Ft
$461/Sq Ft
Est. Value
About This Home
This home is located at 1801 Skycrest Dr Unit 6, Walnut Creek, CA 94595 and is currently estimated at $648,459, approximately $461 per square foot. 1801 Skycrest Dr Unit 6 is a home located in Contra Costa County with nearby schools including Parkmead Elementary School, Walnut Creek Intermediate School, and Las Lomas High School.
Ownership History
Date
Name
Owned For
Owner Type
Purchase Details
Closed on
Feb 29, 2016
Sold by
Foreman Charles J and Foreman Sandra L
Bought by
Charles & Sandra Foreman Living Trust
Current Estimated Value
Purchase Details
Closed on
Aug 20, 2015
Sold by
Campini King Linda
Bought by
Foreman Charles J and Foreman Sandra L
Home Financials for this Owner
Home Financials are based on the most recent Mortgage that was taken out on this home.
Original Mortgage
$266,500
Outstanding Balance
$209,172
Interest Rate
3.97%
Mortgage Type
New Conventional
Estimated Equity
$439,287
Purchase Details
Closed on
Nov 19, 2011
Sold by
Campini Linda A
Bought by
Campini Linda A
Purchase Details
Closed on
Jan 27, 2000
Sold by
Campini Robert W and Campini Winifred M
Bought by
Campini Robert W
Create a Home Valuation Report for This Property
The Home Valuation Report is an in-depth analysis detailing your home's value as well as a comparison with similar homes in the area
Home Values in the Area
Average Home Value in this Area
Purchase History
| Date | Buyer | Sale Price | Title Company |
|---|---|---|---|
| Charles & Sandra Foreman Living Trust | -- | None Available | |
| Foreman Charles J | $410,000 | Old Republic Title Company | |
| Campini Linda A | -- | None Available | |
| Campini Robert W | -- | -- | |
| Campini Robert W | -- | -- |
Source: Public Records
Mortgage History
| Date | Status | Borrower | Loan Amount |
|---|---|---|---|
| Open | Foreman Charles J | $266,500 |
Source: Public Records
Tax History Compared to Growth
Tax History
| Year | Tax Paid | Tax Assessment Tax Assessment Total Assessment is a certain percentage of the fair market value that is determined by local assessors to be the total taxable value of land and additions on the property. | Land | Improvement |
|---|---|---|---|---|
| 2025 | $5,725 | $472,211 | $288,725 | $183,486 |
| 2024 | $5,580 | $462,953 | $283,064 | $179,889 |
| 2023 | $5,580 | $453,876 | $277,514 | $176,362 |
| 2022 | $5,495 | $444,977 | $272,073 | $172,904 |
| 2021 | $5,411 | $436,253 | $266,739 | $169,514 |
| 2019 | $5,274 | $423,315 | $258,828 | $164,487 |
| 2018 | $5,098 | $415,015 | $253,753 | $161,262 |
| 2017 | $4,989 | $406,878 | $248,778 | $158,100 |
| 2016 | $5,103 | $398,900 | $243,900 | $155,000 |
| 2015 | $1,599 | $100,919 | $56,065 | $44,854 |
| 2014 | $1,867 | $98,943 | $54,967 | $43,976 |
Source: Public Records
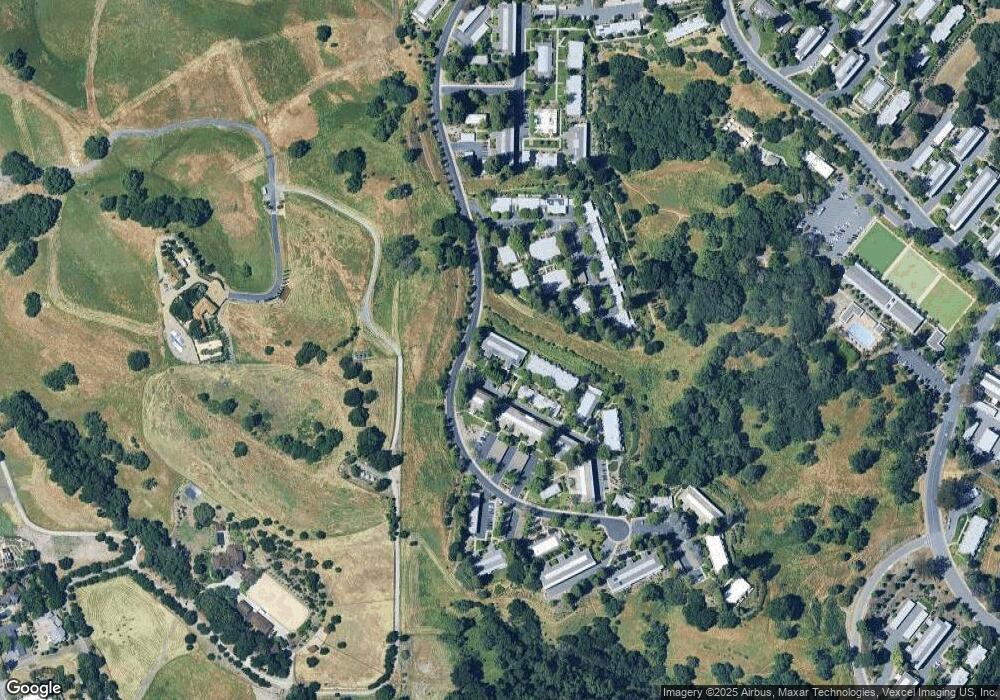
Map
Nearby Homes
- 1909 Skycrest Dr Unit 2
- 2001 Skycrest Dr Unit 4
- 2601 Pine Knoll Dr Unit 8
- 2601 Pine Knoll Dr Unit 4
- 1732 Oakmont Dr Unit 8
- 2501 Pine Knoll Dr Unit 8
- 2573 Golden Rain Rd Unit 4
- 2425 Pine Knoll Dr Unit 1
- 2041 Golden Rain Rd Unit 4
- 2300 Pine Knoll Dr Unit 1
- 2300 Pine Knoll Dr
- 2133 Golden Rain Rd Unit 12
- 2709 Golden Rain Rd Unit 6
- 2200 Pine Knoll Dr Unit 11
- 2224 Pine Knoll Dr Unit 1
- 1549 Oakmont Dr Unit 12
- 1935 Golden Rain Rd Unit 1
- 1441 Oakmont Dr Unit 7
- 2101 Golden Rain Rd Unit 14
- 2409 Golden Rain Rd Unit 6
- 1801 Skycrest Dr Unit 8
- 1801 Skycrest Dr Unit 7
- 1801 Skycrest Dr Unit 4
- 1801 Skycrest Dr Unit 3
- 1801 Skycrest Dr Unit 2
- 1801 Skycrest Dr Unit 1
- 1817 Skycrest Dr Unit 8
- 1817 Skycrest Dr Unit 7
- 1817 Skycrest Dr Unit 6
- 1817 Skycrest Dr Unit 5
- 1817 Skycrest Dr Unit 3
- 1817 Skycrest Dr Unit 2
- 1817 Skycrest Dr Unit 1
- 1833 Skycrest Dr Unit 3
- 1833 Skycrest Dr Unit 2
- 1833 Skycrest Dr Unit 1
- 1901 Skycrest Dr Unit 4
- 1901 Skycrest Dr Unit 3
- 1901 Skycrest Dr Unit 2
- 1901 Skycrest Dr Unit 1