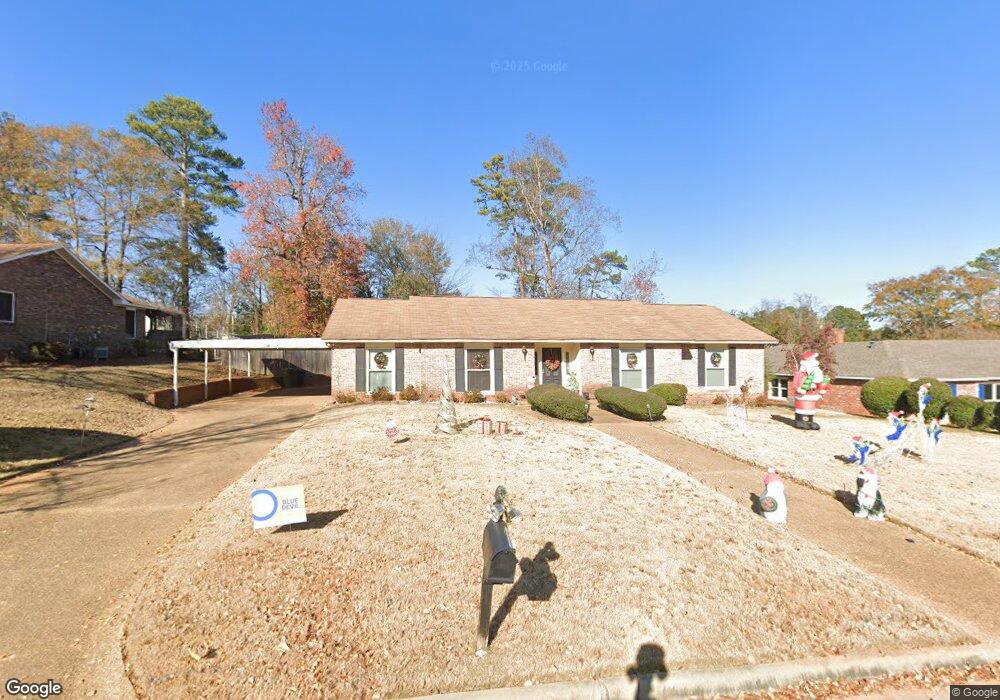
1801 Spring Valley Dr Columbus, GA 31904
North Columbus NeighborhoodEstimated Value: $227,000 - $296,000
4
Beds
3
Baths
2,184
Sq Ft
$119/Sq Ft
Est. Value
About This Home
This home is located at 1801 Spring Valley Dr, Columbus, GA 31904 and is currently estimated at $260,232, approximately $119 per square foot. 1801 Spring Valley Dr is a home located in Muscogee County with nearby schools including Allen Elementary School, Arnold Middle School, and Northside High School.
Ownership History
Date
Name
Owned For
Owner Type
Purchase Details
Closed on
Dec 21, 2017
Sold by
Kennon Realty Svcs Inc
Bought by
Hunter Robert L and Hunter Desiree
Current Estimated Value
Home Financials for this Owner
Home Financials are based on the most recent Mortgage that was taken out on this home.
Original Mortgage
$172,500
Outstanding Balance
$145,155
Interest Rate
3.92%
Mortgage Type
VA
Estimated Equity
$115,077
Purchase Details
Closed on
Mar 7, 2017
Sold by
Debello Glen
Bought by
Kennon Realty Svcs Inc
Purchase Details
Closed on
Apr 2, 2007
Sold by
Melendez Sepulveda Ely Judith and Melendez Rafael
Bought by
Debello Glen
Home Financials for this Owner
Home Financials are based on the most recent Mortgage that was taken out on this home.
Original Mortgage
$191,939
Interest Rate
6.18%
Mortgage Type
VA
Create a Home Valuation Report for This Property
The Home Valuation Report is an in-depth analysis detailing your home's value as well as a comparison with similar homes in the area
Home Values in the Area
Average Home Value in this Area
Purchase History
| Date | Buyer | Sale Price | Title Company |
|---|---|---|---|
| Hunter Robert L | $172,500 | -- | |
| Kennon Realty Svcs Inc | $105,065 | -- | |
| Debello Glen | $187,900 | None Available |
Source: Public Records
Mortgage History
| Date | Status | Borrower | Loan Amount |
|---|---|---|---|
| Open | Hunter Robert L | $172,500 | |
| Previous Owner | Debello Glen | $191,939 |
Source: Public Records
Tax History
| Year | Tax Paid | Tax Assessment Tax Assessment Total Assessment is a certain percentage of the fair market value that is determined by local assessors to be the total taxable value of land and additions on the property. | Land | Improvement |
|---|---|---|---|---|
| 2025 | -- | $79,964 | $13,704 | $66,260 |
| 2024 | -- | $79,964 | $13,704 | $66,260 |
| 2023 | $0 | $79,964 | $13,704 | $66,260 |
| 2022 | $0 | $65,492 | $13,704 | $51,788 |
| 2021 | $0 | $58,968 | $13,704 | $45,264 |
| 2020 | $0 | $58,968 | $13,704 | $45,264 |
| 2019 | $2,347 | $58,968 | $13,704 | $45,264 |
| 2018 | $0 | $57,472 | $13,704 | $43,768 |
| 2017 | $2,347 | $57,096 | $13,704 | $43,392 |
| 2016 | $3,098 | $75,094 | $9,400 | $65,694 |
| 2015 | $3,101 | $75,094 | $9,400 | $65,694 |
| 2014 | $3,105 | $75,094 | $9,400 | $65,694 |
| 2013 | -- | $75,094 | $9,400 | $65,694 |
Source: Public Records
Map
Nearby Homes
- 6328 Fox Chapel Dr
- 6307 Fox Chapel Dr
- 6810 Fawndale Dr
- 6817 Whitesville Rd
- 1627 Doerun Dr
- 1708 Tom Buk Tu Ln
- 2516 Lorraine St
- 2528 Lorraine St
- 5630 Lorenzo Rd
- 6982 Buckhorn Dr
- 43 Chive Ct
- 7031 Mellwood Rd
- 5740 Springhill Ave
- 1045 King Place Dr
- 7313 Sesame St
- 6771 Mobley Rd
- 2977 Blanchard Place
- 1187 Cloverdale Rd
- 6686 Glenmore Way
- 5724 Sanford Ave
- 1807 Spring Valley Dr
- 1723 Spring Valley Dr
- 1807 Springvalley Dr
- 1715 Spring Valley Dr
- 1817 Spring Valley Dr
- 1715 Springvalley Dr
- 1724 Spring Valley Dr
- 1810 Spring Valley Dr
- 1716 Spring Valley Dr
- 6425 Ashwood Dr
- 6440 Fox Chapel Dr
- 2 Spring Valley Ct
- 1818 Spring Valley Dr
- 6448 Fox Chapel Dr
- 4 Springvalley Ct
- 6424 Fox Chapel Dr
- 4 Spring Valley Ct
- 6416 Fox Chapel Dr
- 3 Spring Valley Ct
- 6408 Fox Chapel Dr
Your Personal Tour Guide
Ask me questions while you tour the home.