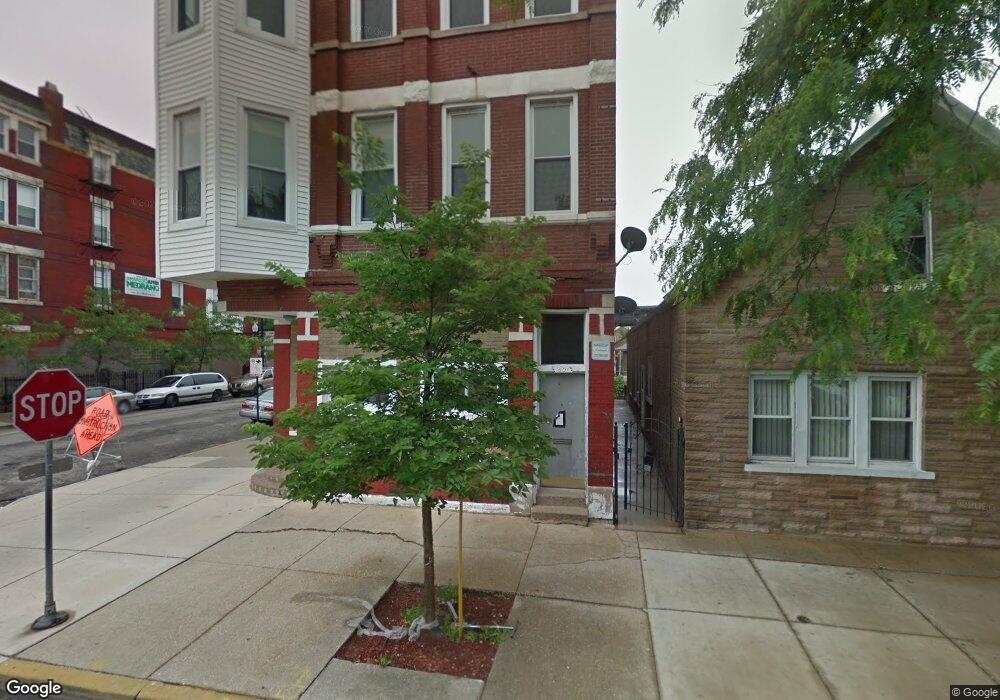
1801 W Cullerton St Chicago, IL 60608
Heart of Chicago Neighborhood
13
Beds
7
Baths
--
Sq Ft
--
Built
About This Home
This home is located at 1801 W Cullerton St, Chicago, IL 60608. 1801 W Cullerton St is a home located in Cook County with nearby schools including Juarez Community Academy High School, Acero - Bartolomé de Las Casas Elementary School, and St. Pius V. School.
Ownership History
Date
Name
Owned For
Owner Type
Purchase Details
Closed on
Jan 5, 2013
Sold by
Mosqueda Raul Antar
Bought by
Chicago Title Land Trust Co and Trust Number 8002360946
Purchase Details
Closed on
Jun 25, 2009
Sold by
Ramirez Guadalupe and Ramirez Maria E
Bought by
Mosqueda Raul Antar
Home Financials for this Owner
Home Financials are based on the most recent Mortgage that was taken out on this home.
Original Mortgage
$320,000
Interest Rate
6.5%
Mortgage Type
Commercial
Purchase Details
Closed on
May 31, 2005
Sold by
Hibbard Andrew B
Bought by
Ramirez Guadalupe and Ramirez Maria E
Purchase Details
Closed on
Jan 5, 2000
Sold by
Regalado Larry
Bought by
Hibbard Andrew B
Home Financials for this Owner
Home Financials are based on the most recent Mortgage that was taken out on this home.
Original Mortgage
$240,000
Interest Rate
8.52%
Mortgage Type
Commercial
Purchase Details
Closed on
Mar 14, 1997
Sold by
American National Bk & Tr Co Of Chicago
Bought by
Vazquez Rachel and Regalado Rachel
Create a Home Valuation Report for This Property
The Home Valuation Report is an in-depth analysis detailing your home's value as well as a comparison with similar homes in the area
Home Values in the Area
Average Home Value in this Area
Purchase History
| Date | Buyer | Sale Price | Title Company |
|---|---|---|---|
| Chicago Title Land Trust Co | -- | None Available | |
| Mosqueda Raul Antar | $400,000 | None Available | |
| Ramirez Guadalupe | $501,000 | Multiple | |
| Hibbard Andrew B | $300,000 | -- | |
| Regalado Larry | $170,000 | -- | |
| Vazquez Rachel | -- | -- |
Source: Public Records
Mortgage History
| Date | Status | Borrower | Loan Amount |
|---|---|---|---|
| Previous Owner | Mosqueda Raul Antar | $320,000 | |
| Previous Owner | Hibbard Andrew B | $240,000 |
Source: Public Records
Tax History Compared to Growth
Tax History
| Year | Tax Paid | Tax Assessment Tax Assessment Total Assessment is a certain percentage of the fair market value that is determined by local assessors to be the total taxable value of land and additions on the property. | Land | Improvement |
|---|---|---|---|---|
| 2024 | $22,555 | $117,900 | $9,065 | $108,835 |
| 2023 | $21,987 | $106,901 | $2,573 | $104,328 |
| 2022 | $21,987 | $106,901 | $2,573 | $104,328 |
| 2021 | $21,496 | $106,899 | $2,572 | $104,327 |
| 2020 | $11,040 | $49,560 | $2,572 | $46,988 |
| 2019 | $9,957 | $49,560 | $2,572 | $46,988 |
| 2018 | $9,790 | $49,560 | $2,572 | $46,988 |
| 2017 | $10,341 | $48,036 | $2,021 | $46,015 |
| 2016 | $9,621 | $48,036 | $2,021 | $46,015 |
| 2015 | $8,802 | $48,036 | $2,021 | $46,015 |
| 2014 | $8,913 | $48,036 | $2,021 | $46,015 |
| 2013 | $8,737 | $48,036 | $2,021 | $46,015 |
Source: Public Records
Map
Nearby Homes
- 1756 W Cullerton St Unit 3
- 1727 W 19th St
- 1823 W Cullerton St
- 1750 W Cermak Rd
- 1635 W 21st Place Unit 2
- 1635 W 21st Place Unit 3
- 1635 W 21st Place Unit 1
- 1917 W 21st St
- 1116 W 18th St
- 2029 W 17th St
- 1645 W 17th St
- 1538 W 21st St Unit 3A
- 1538 W 21st St Unit 1
- 1538 W 21st St Unit 2
- 1744 W 17th St
- 2313 S Wolcott Ave
- 2735 W 16th St
- 2243 S Damen Ave
- 1521 W 17th St Unit 3
- 1521 W 17th St Unit 2
- 1803 W Cullerton St
- 1805 W Cullerton St
- 1805 W Cullerton St
- 1809 W Cullerton St
- 1759 W Cullerton St
- 1759 W Cullerton St Unit 1S
- 1759 W Cullerton St Unit 4S
- 1759 W Cullerton St Unit 3N
- 1811 W Cullerton St
- 1757 W Cullerton St Unit 2
- 1813 W Cullerton St
- 1753 W Cullerton St
- 1800 W Cullerton St
- 1804 W Cullerton St
- 1817 W Cullerton St Unit 1
- 1751 W Cullerton St
- 1751 W Cullerton St Unit 2F
- 1751 W Cullerton St Unit 1F
- 1810 W Cullerton St Unit 1
- 1810 W Cullerton St Unit 2