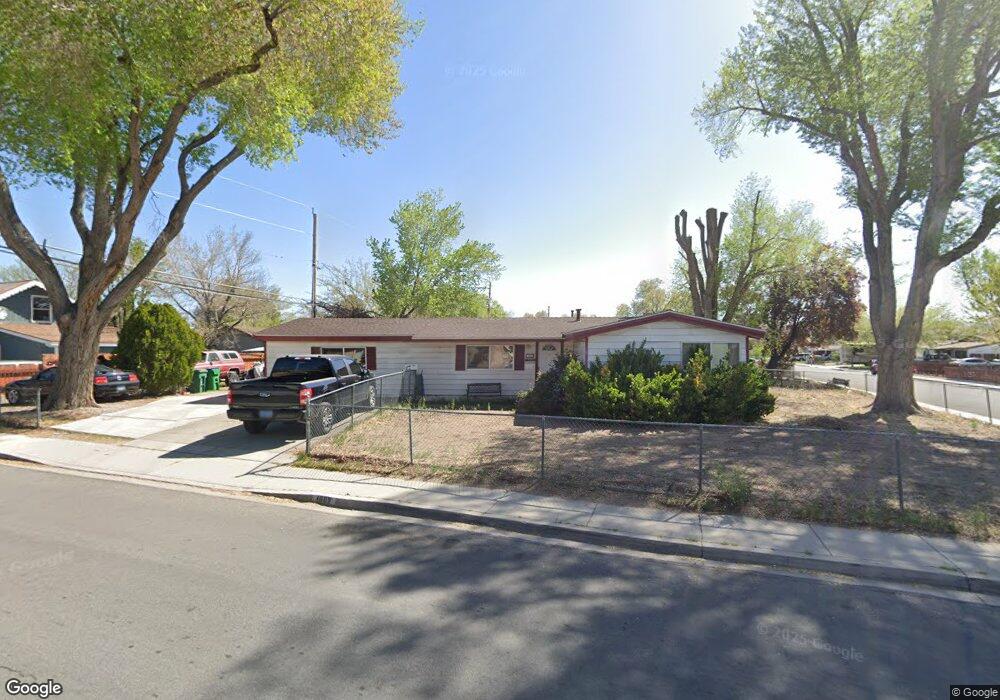
1802 11th St Sparks, NV 89431
North Rock NeighborhoodEstimated Value: $406,000 - $424,000
3
Beds
2
Baths
1,788
Sq Ft
$232/Sq Ft
Est. Value
About This Home
This home is located at 1802 11th St, Sparks, NV 89431 and is currently estimated at $414,447, approximately $231 per square foot. 1802 11th St is a home located in Washoe County with nearby schools including Alice Maxwell Elementary School, Sparks Middle School, and Sparks High School.
Ownership History
Date
Name
Owned For
Owner Type
Purchase Details
Closed on
Jan 30, 2007
Sold by
Zukovsky Richard and Zukovsky Michelle
Bought by
Mcallister Jerry and Mcallister Dorla
Current Estimated Value
Home Financials for this Owner
Home Financials are based on the most recent Mortgage that was taken out on this home.
Original Mortgage
$251,750
Outstanding Balance
$161,400
Interest Rate
7.75%
Mortgage Type
Unknown
Estimated Equity
$253,047
Purchase Details
Closed on
Mar 25, 2004
Sold by
Gonzales Rosendo Villegas and Gonzales Felipe Villegas
Bought by
Zukovsky Richard and Zukovsky Michelle
Purchase Details
Closed on
Feb 23, 2001
Sold by
Nitsch Barbara
Bought by
Villegas Gonzalez Rosendo Villegas and Villegas Gonzalez Felipe
Home Financials for this Owner
Home Financials are based on the most recent Mortgage that was taken out on this home.
Original Mortgage
$124,545
Interest Rate
6.89%
Mortgage Type
FHA
Purchase Details
Closed on
Feb 21, 2001
Sold by
Villegas Ruvalcaba Rosa
Bought by
Gonzalez Rosendo Villegas
Home Financials for this Owner
Home Financials are based on the most recent Mortgage that was taken out on this home.
Original Mortgage
$124,545
Interest Rate
6.89%
Mortgage Type
FHA
Create a Home Valuation Report for This Property
The Home Valuation Report is an in-depth analysis detailing your home's value as well as a comparison with similar homes in the area
Home Values in the Area
Average Home Value in this Area
Purchase History
| Date | Buyer | Sale Price | Title Company |
|---|---|---|---|
| Mcallister Jerry | $265,000 | First Centennial Title Co | |
| Zukovsky Richard | $148,000 | Stewart Title Of Northern Nv | |
| Villegas Gonzalez Rosendo Villegas | $126,500 | Western Title Inc | |
| Gonzalez Rosendo Villegas | -- | Western Title Inc |
Source: Public Records
Mortgage History
| Date | Status | Borrower | Loan Amount |
|---|---|---|---|
| Open | Mcallister Jerry | $251,750 | |
| Previous Owner | Villegas Gonzalez Rosendo Villegas | $124,545 |
Source: Public Records
Tax History Compared to Growth
Tax History
| Year | Tax Paid | Tax Assessment Tax Assessment Total Assessment is a certain percentage of the fair market value that is determined by local assessors to be the total taxable value of land and additions on the property. | Land | Improvement |
|---|---|---|---|---|
| 2026 | $603 | $53,905 | $33,600 | $20,305 |
| 2025 | $785 | $51,474 | $31,325 | $20,150 |
| 2024 | $763 | $50,015 | $30,100 | $19,915 |
| 2023 | $551 | $48,245 | $29,890 | $18,355 |
| 2022 | $741 | $40,038 | $25,095 | $14,943 |
| 2021 | $721 | $31,193 | $16,765 | $14,428 |
| 2020 | $697 | $30,684 | $16,345 | $14,339 |
| 2019 | $678 | $29,426 | $15,890 | $13,536 |
| 2018 | $657 | $24,229 | $11,235 | $12,994 |
| 2017 | $639 | $23,128 | $10,150 | $12,978 |
| 2016 | $623 | $21,224 | $8,225 | $12,999 |
| 2015 | $624 | $20,010 | $7,140 | $12,870 |
| 2014 | $605 | $18,922 | $6,440 | $12,482 |
| 2013 | -- | $16,081 | $3,955 | $12,126 |
Source: Public Records
Map
Nearby Homes
- 1003 Sbragia Way
- 1023 Tyler Way
- 1121 Greenbrae Dr
- 1110 Xman Way
- 1365 Prospect Ave
- 1160 York Way
- 1345 Plymouth Way
- 1125 Dodson Way
- 1655 Byrd Dr
- 1665 London Cir
- 1595 York Way
- 985 10th St
- 1010 12th St
- 1945 4th St Unit 32
- 1945 4th St Unit 33
- 1945 4th St Unit 51
- 1701 London Cir
- 1780 Greenbrae Dr
- 1527 Steven Ct
- 1536 Irene Way