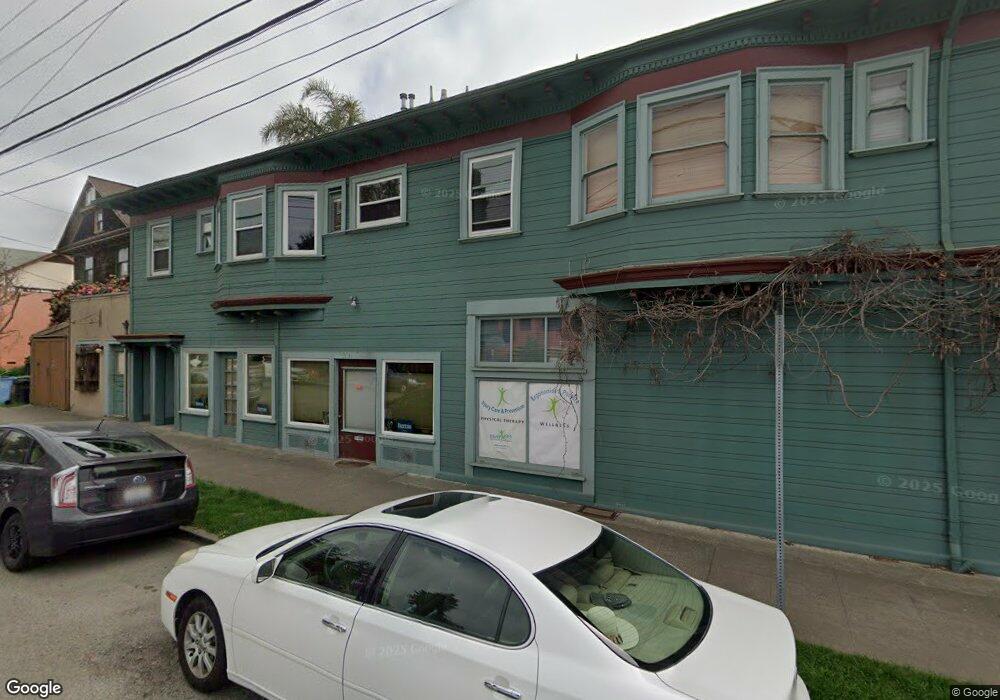
1802 Bancroft Way Unit 1802 Berkeley, CA 94703
Downtown Berkeley NeighborhoodEstimated Value: $769,000 - $2,020,000
5
Beds
2
Baths
2,678
Sq Ft
$476/Sq Ft
Est. Value
About This Home
This home is located at 1802 Bancroft Way Unit 1802, Berkeley, CA 94703 and is currently estimated at $1,274,434, approximately $475 per square foot. 1802 Bancroft Way Unit 1802 is a home located in Alameda County with nearby schools including Washington Elementary School, Berkeley Arts Magnet at Whittier School, and Oxford Elementary School.
Ownership History
Date
Name
Owned For
Owner Type
Purchase Details
Closed on
Jun 7, 2024
Sold by
Christopher Hershey Trust and Hershey Christopher Aldus
Bought by
Gerald D Lenoir Jr And Karen Dalton-Lenoir Li and Lenoir
Current Estimated Value
Purchase Details
Closed on
Nov 7, 2023
Sold by
Hershey Christopher
Bought by
Gerald D Lenoir Jr And Karen T Dalton-Lenoir and Lenoir
Purchase Details
Closed on
Oct 31, 2003
Sold by
Faraclas Nicholas
Bought by
Lenoir Gerald D and Dalton Lenoir Karen
Home Financials for this Owner
Home Financials are based on the most recent Mortgage that was taken out on this home.
Original Mortgage
$230,000
Interest Rate
5.72%
Mortgage Type
Purchase Money Mortgage
Create a Home Valuation Report for This Property
The Home Valuation Report is an in-depth analysis detailing your home's value as well as a comparison with similar homes in the area
Home Values in the Area
Average Home Value in this Area
Purchase History
| Date | Buyer | Sale Price | Title Company |
|---|---|---|---|
| Gerald D Lenoir Jr And Karen Dalton-Lenoir Li | $160,000 | None Listed On Document | |
| Gerald D Lenoir Jr And Karen T Dalton-Lenoir | $160,000 | None Listed On Document | |
| Lenoir Gerald D | $68,500 | First American Title Co |
Source: Public Records
Mortgage History
| Date | Status | Borrower | Loan Amount |
|---|---|---|---|
| Previous Owner | Lenoir Gerald D | $230,000 | |
| Closed | Lenoir Gerald D | $200,000 |
Source: Public Records
Tax History
| Year | Tax Paid | Tax Assessment Tax Assessment Total Assessment is a certain percentage of the fair market value that is determined by local assessors to be the total taxable value of land and additions on the property. | Land | Improvement |
|---|---|---|---|---|
| 2025 | $11,695 | $773,316 | $234,056 | $546,260 |
| 2024 | $11,695 | $537,982 | $163,447 | $381,535 |
| 2023 | $11,419 | $527,297 | $160,243 | $374,054 |
| 2022 | $11,133 | $516,822 | $157,101 | $366,721 |
| 2021 | $11,111 | $506,554 | $154,022 | $359,532 |
| 2020 | $10,290 | $508,291 | $152,443 | $355,848 |
| 2019 | $9,645 | $498,327 | $149,455 | $348,872 |
| 2018 | $9,436 | $488,557 | $146,525 | $342,032 |
| 2017 | $9,107 | $478,978 | $143,652 | $335,326 |
| 2016 | $8,744 | $469,589 | $140,836 | $328,753 |
| 2015 | $6,456 | $293,677 | $88,046 | $205,631 |
| 2014 | $6,338 | $287,925 | $86,322 | $201,603 |
Source: Public Records
Map
Nearby Homes
- 2218 -2222 Grant St
- 1645 Dwight Way
- 2118 California St
- 1901 Parker St Unit 3
- 2018 Blake St
- 2350 Sacramento St
- 1612 Parker St
- 2701 Grant St
- 1612 Carleton St
- 1813 Sacramento St
- 1515 Derby St
- 2015 Delaware St
- 2015 Delaware St Unit A
- 1436 Delaware St
- 1411 Hearst Ave Unit 2
- 2750 Sacramento St
- 1450 Ward St
- 2758 Sacramento St
- 1530 Stuart St
- 2774 Sacramento St
- 2303 Grant St
- 1808 Bancroft Way
- 2309 Grant St
- 1812 Bancroft Way
- 1816 Bancroft Way
- 2300 Grant St
- 2304 Grant St Unit c
- 2308 Grant St
- 1740 Bancroft Way
- 2240 Grant St
- 2310 Grant St
- 1741 Bancroft Way
- 1736 Bancroft Way
- 2323 Grant St
- 2239 Grant St
- 2314 Grant St
- 1739 Bancroft Way
- 2326 Grant St
- 1734 Bancroft Way
- 1737 Bancroft Way
Your Personal Tour Guide
Ask me questions while you tour the home.