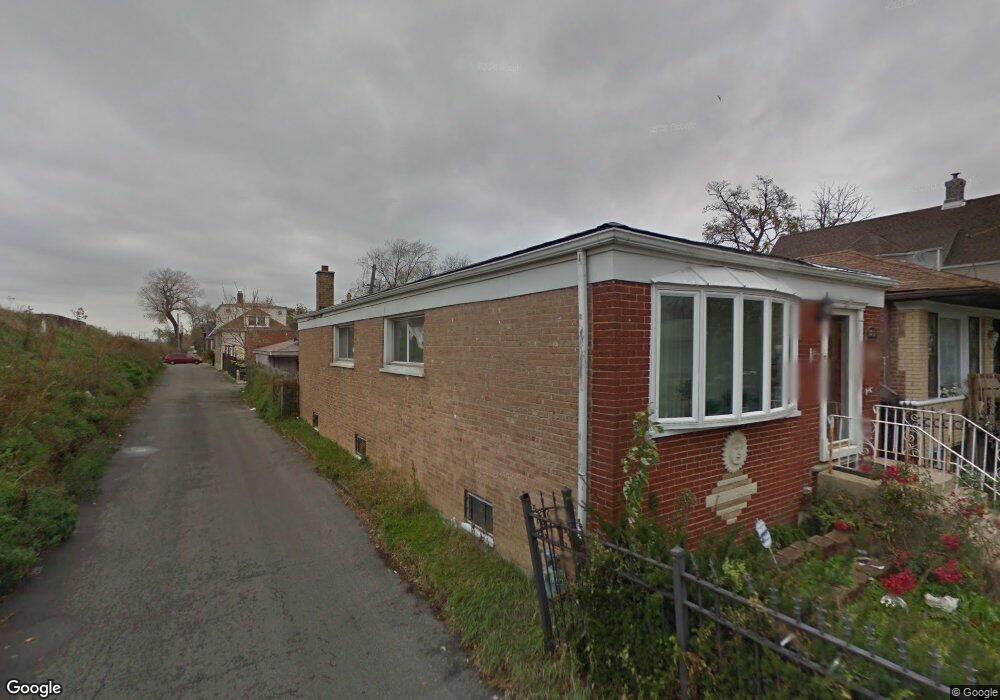
1802 N Keeler Ave Chicago, IL 60639
Hermosa NeighborhoodEstimated Value: $368,000 - $426,000
3
Beds
2
Baths
2,400
Sq Ft
$163/Sq Ft
Est. Value
About This Home
This home is located at 1802 N Keeler Ave, Chicago, IL 60639 and is currently estimated at $391,195, approximately $162 per square foot. 1802 N Keeler Ave is a home located in Cook County with nearby schools including Nixon Elementary School, North-Grand High School, and Kelvyn Park High School.
Ownership History
Date
Name
Owned For
Owner Type
Purchase Details
Closed on
Dec 17, 2020
Sold by
Perez Jovani and Bastidas Lizbeth
Bought by
Perez Jovani and Perez Alexis
Current Estimated Value
Home Financials for this Owner
Home Financials are based on the most recent Mortgage that was taken out on this home.
Original Mortgage
$227,200
Outstanding Balance
$203,312
Interest Rate
2.99%
Mortgage Type
New Conventional
Estimated Equity
$187,883
Purchase Details
Closed on
Oct 24, 2017
Sold by
Montesdeoca Braudio S
Bought by
Perez Jovani and Bastidas Lizbeth
Home Financials for this Owner
Home Financials are based on the most recent Mortgage that was taken out on this home.
Original Mortgage
$239,112
Interest Rate
3.75%
Mortgage Type
FHA
Purchase Details
Closed on
May 5, 2017
Sold by
Mdg Fund I Llc
Bought by
Montesdeoca Braudio S
Purchase Details
Closed on
Oct 24, 2016
Sold by
County Of Cook
Bought by
Mdg Fund 1 Llc
Purchase Details
Closed on
May 30, 2001
Sold by
Batista Luis A and Batista Milagros
Bought by
Alejandro Nancy M and Batista Milagros
Create a Home Valuation Report for This Property
The Home Valuation Report is an in-depth analysis detailing your home's value as well as a comparison with similar homes in the area
Home Values in the Area
Average Home Value in this Area
Purchase History
| Date | Buyer | Sale Price | Title Company |
|---|---|---|---|
| Perez Jovani | -- | First American Title | |
| Perez Jovani | $245,000 | Heritage Title Company | |
| Montesdeoca Braudio S | $129,000 | Chicago Title | |
| Mdg Fund 1 Llc | -- | None Available | |
| Alejandro Nancy M | -- | -- |
Source: Public Records
Mortgage History
| Date | Status | Borrower | Loan Amount |
|---|---|---|---|
| Open | Perez Jovani | $227,200 | |
| Closed | Perez Jovani | $239,112 |
Source: Public Records
Tax History Compared to Growth
Tax History
| Year | Tax Paid | Tax Assessment Tax Assessment Total Assessment is a certain percentage of the fair market value that is determined by local assessors to be the total taxable value of land and additions on the property. | Land | Improvement |
|---|---|---|---|---|
| 2024 | $4,871 | $22,001 | $7,813 | $14,188 |
| 2023 | $4,747 | $23,000 | $6,250 | $16,750 |
| 2022 | $4,747 | $23,000 | $6,250 | $16,750 |
| 2021 | $4,641 | $23,003 | $6,253 | $16,750 |
| 2020 | $4,173 | $18,663 | $3,906 | $14,757 |
| 2019 | $4,228 | $20,970 | $3,906 | $17,064 |
| 2018 | $4,142 | $20,970 | $3,906 | $17,064 |
| 2017 | $3,149 | $18,005 | $3,437 | $14,568 |
| 2016 | $3,106 | $18,005 | $3,437 | $14,568 |
| 2015 | $2,819 | $18,005 | $3,437 | $14,568 |
| 2014 | $2,831 | $17,825 | $3,125 | $14,700 |
| 2013 | $2,764 | $17,825 | $3,125 | $14,700 |
Source: Public Records
Map
Nearby Homes
- 1744 N Keeler Ave
- 1724 N Keeler Ave
- 1722 N Keeler Ave
- 1912 N Lowell Ave
- 1916 N Lowell Ave
- 1637 N Keeler Ave
- 1615 N Keeler Ave
- 1940 N Pulaski Rd
- 1748 N Harding Ave
- 1930 N Kenneth Ave
- 2109 N Karlov Ave
- 1920 N Springfield Ave Unit 3N
- 2134 N Keeler Ave
- 2054 N Pulaski Rd
- 2106 N Pulaski Rd
- 3902 W Armitage Ave
- 2016 N Kilbourn Ave
- 4311 W Palmer St
- 1435 N Kolin Ave
- 1530 N Springfield Ave
- 1806 N Keeler Ave
- 1808 N Keeler Ave
- 1810 N Keeler Ave
- 1814 N Keeler Ave
- 1803 N Tripp Ave
- 1807 N Tripp Ave
- 1818 N Keeler Ave
- 1809 N Tripp Ave
- 1813 N Tripp Ave
- 1754 N Keeler Ave
- 1811 N Tripp Ave Unit 2
- 1811 N Tripp Ave
- 1820 N Keeler Ave
- 1805 N Keeler Ave
- 1803 N Keeler Ave
- 1807 N Keeler Ave
- 1815 N Tripp Ave
- 1813 N Keeler Ave
- 1813 N Keeler Ave Unit 1
- 1809 N Keeler Ave