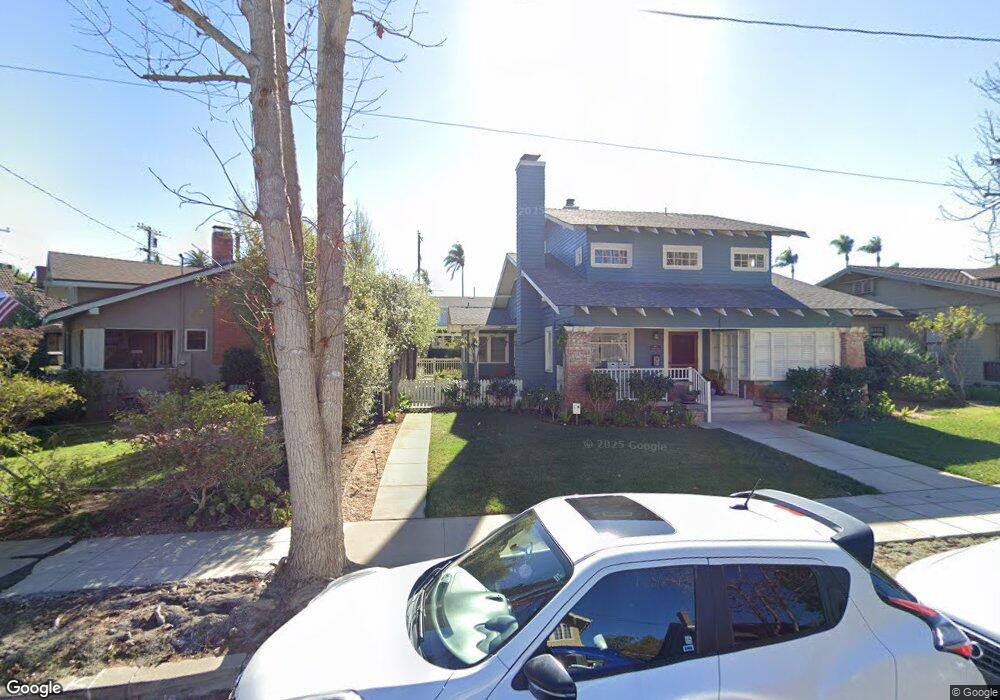
1803 Altura Place Unit 5 San Diego, CA 92103
Mission Hills NeighborhoodEstimated Value: $2,390,524 - $3,063,000
4
Beds
3
Baths
2,641
Sq Ft
$1,027/Sq Ft
Est. Value
About This Home
This home is located at 1803 Altura Place Unit 5, San Diego, CA 92103 and is currently estimated at $2,711,131, approximately $1,026 per square foot. 1803 Altura Place Unit 5 is a home located in San Diego County with nearby schools including Grant K-8, Richard Henry Dana Middle School, and Roosevelt International Middle School.
Ownership History
Date
Name
Owned For
Owner Type
Purchase Details
Closed on
May 11, 2012
Sold by
Wimpey Christopher York and York Brenda Lee
Bought by
Renas David Allen and Renas Laurie Fink
Current Estimated Value
Home Financials for this Owner
Home Financials are based on the most recent Mortgage that was taken out on this home.
Original Mortgage
$800,000
Outstanding Balance
$108,896
Interest Rate
3.19%
Mortgage Type
New Conventional
Estimated Equity
$2,602,235
Purchase Details
Closed on
Nov 9, 1994
Sold by
Greenberg Howard B and Greenberg Andrea A
Bought by
Wimpey Christopher York and York Brenda Lee
Home Financials for this Owner
Home Financials are based on the most recent Mortgage that was taken out on this home.
Original Mortgage
$360,000
Interest Rate
5.75%
Purchase Details
Closed on
Sep 8, 1993
Sold by
Greenberg Howard
Bought by
Greenberg Howard B and Greenberg Andrea A
Purchase Details
Closed on
May 15, 1991
Create a Home Valuation Report for This Property
The Home Valuation Report is an in-depth analysis detailing your home's value as well as a comparison with similar homes in the area
Home Values in the Area
Average Home Value in this Area
Purchase History
| Date | Buyer | Sale Price | Title Company |
|---|---|---|---|
| Renas David Allen | $1,000,000 | Ticor Title San Diego Branch | |
| Wimpey Christopher York | $450,000 | Chicago Title Company | |
| Greenberg Howard B | -- | -- | |
| -- | $335,000 | -- |
Source: Public Records
Mortgage History
| Date | Status | Borrower | Loan Amount |
|---|---|---|---|
| Open | Renas David Allen | $800,000 | |
| Previous Owner | Wimpey Christopher York | $360,000 |
Source: Public Records
Tax History Compared to Growth
Tax History
| Year | Tax Paid | Tax Assessment Tax Assessment Total Assessment is a certain percentage of the fair market value that is determined by local assessors to be the total taxable value of land and additions on the property. | Land | Improvement |
|---|---|---|---|---|
| 2025 | $15,082 | $1,256,043 | $816,430 | $439,613 |
| 2024 | $15,082 | $1,231,416 | $800,422 | $430,994 |
| 2023 | $14,747 | $1,207,272 | $784,728 | $422,544 |
| 2022 | $14,353 | $1,183,601 | $769,342 | $414,259 |
| 2021 | $14,253 | $1,160,394 | $754,257 | $406,137 |
| 2020 | $14,080 | $1,148,497 | $746,524 | $401,973 |
| 2019 | $13,827 | $1,125,979 | $731,887 | $394,092 |
| 2018 | $12,925 | $1,103,902 | $717,537 | $386,365 |
| 2017 | $12,616 | $1,082,258 | $703,468 | $378,790 |
| 2016 | $12,412 | $1,061,038 | $689,675 | $371,363 |
| 2015 | $12,228 | $1,045,101 | $679,316 | $365,785 |
| 2014 | $12,034 | $1,024,630 | $666,010 | $358,620 |
Source: Public Records
Map
Nearby Homes
- 1860 W Montecito Way
- 1818 Sunset Blvd
- 4194 Stephens St
- 4399 Hermosa Way
- 1728 W Lewis St
- Lot 19 Randolph St
- 1750 Washington Place
- 4285 Randolph St
- 1625 Hotel Cir S Unit C309
- 1615 Hotel Cir S Unit D103
- 4171 Ibis St
- 4109 Ibis St
- 1828 Linwood St Unit 1
- 1695 Neale St
- 1694 Torrance St
- 3625 Keating St Unit 4
- 2235 Linwood St Unit A7
- 4396 Arcadia Dr
- 3961 Hortensia St Unit H4
- 1670 Guy St Unit B
- 4298 Hermosa Way
- 1815 Altura Place
- 4290 Hermosa Way
- 1821 Altura Place
- 1846 W Montecito Way
- 4280 Hermosa Way
- 1840 W Montecito Way
- 1806 Altura Place
- 1835 Altura Place
- 1850 W Montecito Way
- 4295 Hermosa Way
- 1828 W Montecito Way
- 4301 Hermosa Way
- 1812 Altura Place
- 1824 Altura Place
- 1866 W Montecito Way
- 1839 Altura Place
- 1818 W Montecito Way
- 4316 Hermosa Way
- 4291 Hermosa Way