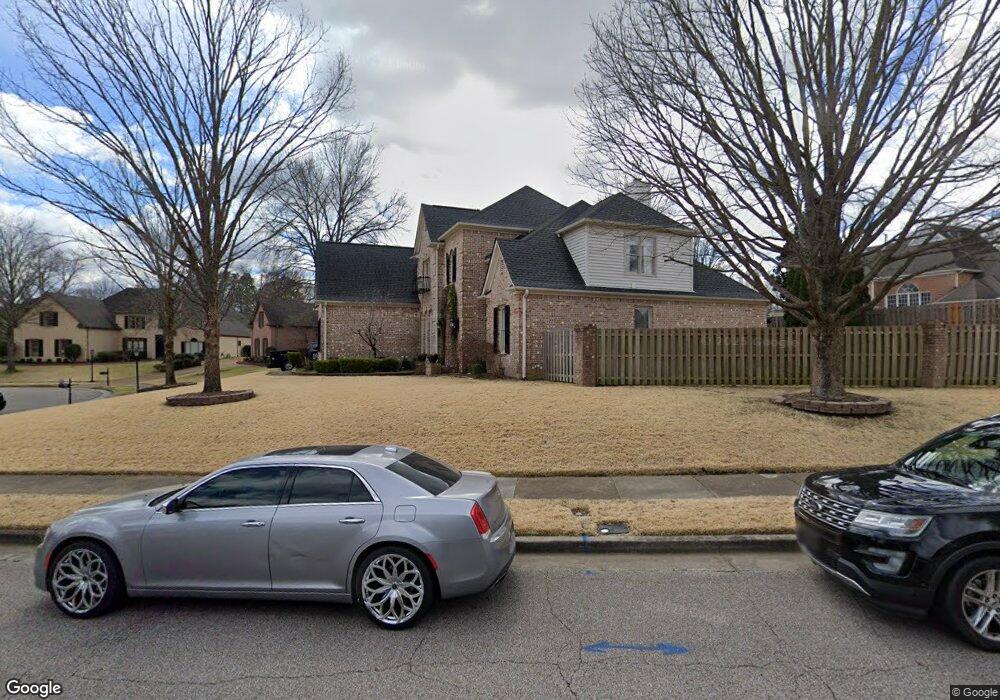
1803 Hartwell Manor N Collierville, TN 38017
Estimated Value: $644,144 - $697,000
4
Beds
4
Baths
3,862
Sq Ft
$175/Sq Ft
Est. Value
About This Home
This home is located at 1803 Hartwell Manor N, Collierville, TN 38017 and is currently estimated at $674,286, approximately $174 per square foot. 1803 Hartwell Manor N is a home located in Shelby County with nearby schools including Bailey Station Elementary School, West Collierville Middle School, and Collierville High School.
Ownership History
Date
Name
Owned For
Owner Type
Purchase Details
Closed on
Dec 1, 2010
Sold by
Tillman Clifford D
Bought by
Tillman Clifford D and Tillman Amy B
Current Estimated Value
Home Financials for this Owner
Home Financials are based on the most recent Mortgage that was taken out on this home.
Original Mortgage
$366,520
Outstanding Balance
$243,382
Interest Rate
4.32%
Mortgage Type
New Conventional
Estimated Equity
$430,904
Purchase Details
Closed on
May 31, 2006
Sold by
Johnson Mary G and Johnson Roger B
Bought by
Tillman Clifford D
Home Financials for this Owner
Home Financials are based on the most recent Mortgage that was taken out on this home.
Original Mortgage
$377,950
Interest Rate
6.44%
Mortgage Type
Fannie Mae Freddie Mac
Purchase Details
Closed on
Apr 22, 2003
Sold by
Futrell Andy
Bought by
Johnson Roger B and Johnson Mary G
Home Financials for this Owner
Home Financials are based on the most recent Mortgage that was taken out on this home.
Original Mortgage
$290,000
Interest Rate
5.6%
Purchase Details
Closed on
Feb 28, 2000
Sold by
Pulte Homes Tennessee Ltd Partnership
Bought by
Futrell Andy
Create a Home Valuation Report for This Property
The Home Valuation Report is an in-depth analysis detailing your home's value as well as a comparison with similar homes in the area
Home Values in the Area
Average Home Value in this Area
Purchase History
| Date | Buyer | Sale Price | Title Company |
|---|---|---|---|
| Tillman Clifford D | -- | None Available | |
| Tillman Clifford D | $472,450 | Stewart Title Of Memphis Inc | |
| Johnson Roger B | $394,000 | -- | |
| Futrell Andy | $62,500 | -- |
Source: Public Records
Mortgage History
| Date | Status | Borrower | Loan Amount |
|---|---|---|---|
| Open | Tillman Clifford D | $366,520 | |
| Closed | Tillman Clifford D | $377,950 | |
| Previous Owner | Johnson Roger B | $290,000 |
Source: Public Records
Tax History Compared to Growth
Tax History
| Year | Tax Paid | Tax Assessment Tax Assessment Total Assessment is a certain percentage of the fair market value that is determined by local assessors to be the total taxable value of land and additions on the property. | Land | Improvement |
|---|---|---|---|---|
| 2025 | $4,350 | $165,400 | $23,375 | $142,025 |
| 2024 | $4,350 | $128,325 | $23,375 | $104,950 |
| 2023 | $6,711 | $128,325 | $23,375 | $104,950 |
| 2022 | $6,557 | $128,325 | $23,375 | $104,950 |
| 2021 | $6,634 | $128,325 | $23,375 | $104,950 |
| 2020 | $6,493 | $110,425 | $23,375 | $87,050 |
| 2019 | $4,472 | $110,425 | $23,375 | $87,050 |
| 2018 | $4,472 | $110,425 | $23,375 | $87,050 |
| 2017 | $4,538 | $110,425 | $23,375 | $87,050 |
| 2016 | $4,572 | $104,625 | $0 | $0 |
| 2014 | $4,572 | $104,625 | $0 | $0 |
Source: Public Records
Map
Nearby Homes
- 1911 Swynford Ln
- 1923 Swynford Ln
- 1842 Swynford Ln
- 1893 Hartwell Manor W
- 2167 Neshoba Nook Cir
- 1908 McCool Forest Ln
- 1941 Lonhill Dr
- 10290 Shrewsbury Run W
- 1931 Katz Place
- 1955 Coors Creek Dr
- 1901 Newton Nook
- 1715 Powell Run Cove
- 2069 Standing Rock Ave
- 2106 Carisbrooke Dr
- 2087 Standing Rock Ave
- 10018 Bushrod Cove
- 10050 Avent Ridge Cove
- 9940 Houston Oaks Dr
- 10400 Page Manor Cove
- 2195 Houston Pass
- 1797 Hartwell Manor N
- 1910 Swynford Ln
- 1792 Napier Woods Dr
- 1922 Swynford Ln
- 1806 Hartwell Manor N
- 1900 Swynford Ln
- 1793 Hartwell Manor N
- 1814 Hartwell Manor N
- 1783 Hartwell Manor N
- 1786 Napier Woods Dr
- 1890 Swynford Ln
- 1780 Hartwell Manor N
- 1822 Hartwell Manor N
- 1806 Dymoke Dr
- 1807 Liles Ln
- 1796 Dymoke Dr
- 1775 Hartwell Manor N
- 1813 Liles Ln
- 1901 Swynford Ln
- 1817 Liles Ln