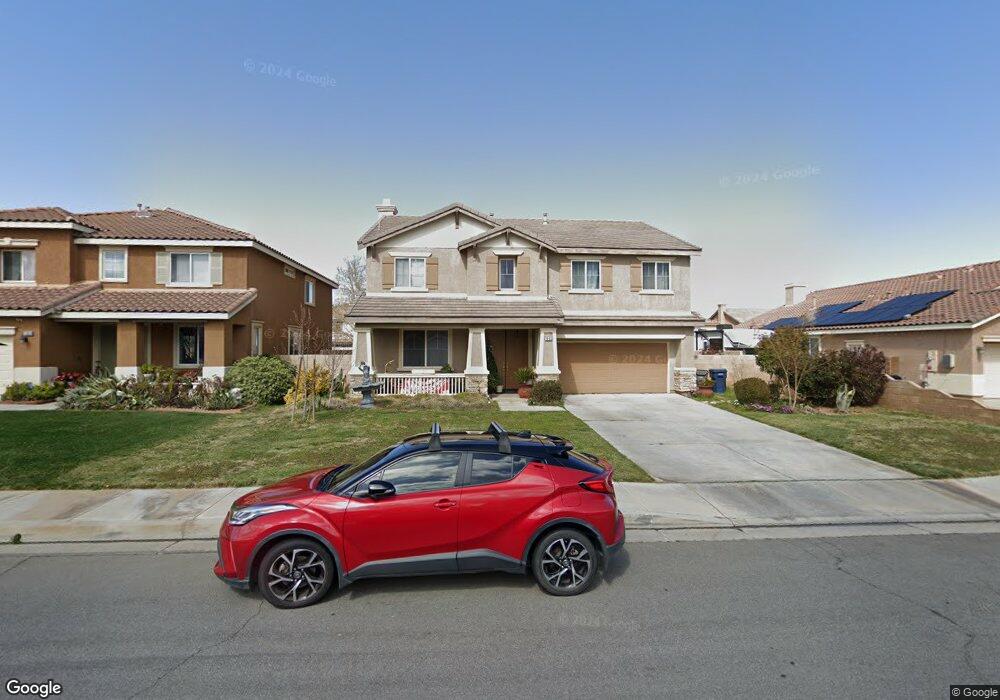
1803 Hideaway Place Palmdale, CA 93551
West Palmdale NeighborhoodEstimated Value: $590,543 - $664,000
3
Beds
3
Baths
2,956
Sq Ft
$212/Sq Ft
Est. Value
About This Home
This home is located at 1803 Hideaway Place, Palmdale, CA 93551 and is currently estimated at $627,886, approximately $212 per square foot. 1803 Hideaway Place is a home located in Los Angeles County with nearby schools including Summerwind Elementary School, David G. Millen Magnet Academy, and Highland High School.
Ownership History
Date
Name
Owned For
Owner Type
Purchase Details
Closed on
Feb 22, 2024
Sold by
Flores Arturo and Flores Maria Elizabeth
Bought by
Arturo And Maria Flores 2024 Trust and Flores
Current Estimated Value
Purchase Details
Closed on
Jun 17, 2011
Sold by
Modern Vision Inc
Bought by
Flores Arturo and Flores Maria E
Home Financials for this Owner
Home Financials are based on the most recent Mortgage that was taken out on this home.
Original Mortgage
$236,839
Interest Rate
4.45%
Mortgage Type
FHA
Purchase Details
Closed on
Mar 9, 2011
Sold by
Hiraeta Jaime A
Bought by
Modern Vision Inc
Purchase Details
Closed on
Nov 25, 2003
Sold by
Wl Homes Llc
Bought by
Hiraeta Jaime A
Home Financials for this Owner
Home Financials are based on the most recent Mortgage that was taken out on this home.
Original Mortgage
$248,900
Interest Rate
5.65%
Mortgage Type
Purchase Money Mortgage
Create a Home Valuation Report for This Property
The Home Valuation Report is an in-depth analysis detailing your home's value as well as a comparison with similar homes in the area
Home Values in the Area
Average Home Value in this Area
Purchase History
| Date | Buyer | Sale Price | Title Company |
|---|---|---|---|
| Arturo And Maria Flores 2024 Trust | -- | None Listed On Document | |
| Flores Arturo | $243,000 | Chicago Title Company | |
| Modern Vision Inc | $177,800 | None Available | |
| Hiraeta Jaime A | $311,500 | Fidelity National Title |
Source: Public Records
Mortgage History
| Date | Status | Borrower | Loan Amount |
|---|---|---|---|
| Previous Owner | Flores Arturo | $236,839 | |
| Previous Owner | Hiraeta Jaime A | $248,900 |
Source: Public Records
Tax History
| Year | Tax Paid | Tax Assessment Tax Assessment Total Assessment is a certain percentage of the fair market value that is determined by local assessors to be the total taxable value of land and additions on the property. | Land | Improvement |
|---|---|---|---|---|
| 2025 | $5,075 | $305,207 | $61,037 | $244,170 |
| 2024 | $5,075 | $299,224 | $59,841 | $239,383 |
| 2023 | $4,988 | $293,358 | $58,668 | $234,690 |
| 2022 | $4,812 | $287,607 | $57,518 | $230,089 |
| 2021 | $4,687 | $281,969 | $56,391 | $225,578 |
| 2019 | $4,569 | $273,607 | $54,719 | $218,888 |
| 2018 | $4,498 | $268,244 | $53,647 | $214,597 |
| 2016 | $4,154 | $257,830 | $51,565 | $206,265 |
| 2015 | $4,115 | $253,958 | $50,791 | $203,167 |
| 2014 | $4,048 | $248,985 | $49,797 | $199,188 |
Source: Public Records
Map
Nearby Homes
- 1820 Hideaway Place
- 39118 Dunbar St
- 1847 Heritage Ln
- 1806 W Avenue p4
- 39272 Arrowhead Ct
- 0000 27 Ave
- 2038 Falcon Ave
- 2049 Millcreek Way
- 38948 Glenwood Dr
- 1728 Blackberry Ct
- 2108 Cork Oak St
- 2050 Helconia Ct
- 1429 Wellington Dr
- 38994 Foxholm Dr
- 38927 Deer Run Rd
- 12 W Avenue p8
- 2002 Willowbrook Ave
- 38841 Foxholm Dr
- 38870 Foxholm Dr
- 2047 Sundance Ct
- 1809 Hideaway Place
- 1797 Hideaway Place
- 1804 Sunshine Pkwy
- 1817 Hideaway Place
- 1791 Hideaway Place
- 1810 Sunshine Pkwy
- 1798 Sunshine Pkwy
- 1802 Hideaway Place
- 1808 Hideaway Place
- 1818 Sunshine Pkwy
- 1792 Sunshine Pkwy
- 1796 Hideaway Place
- 38324 Fawnridge Cir
- 1823 Hideaway Place
- 1785 Hideaway Place
- 1790 Hideaway Place
- 1824 Sunshine Pkwy
- 1786 Sunshine Pkwy
- 1831 Hideaway Place
- 1826 Hideaway Place
Your Personal Tour Guide
Ask me questions while you tour the home.