Estimated Value: $297,822 - $445,000
2
Beds
1
Bath
1,092
Sq Ft
$329/Sq Ft
Est. Value
About This Home
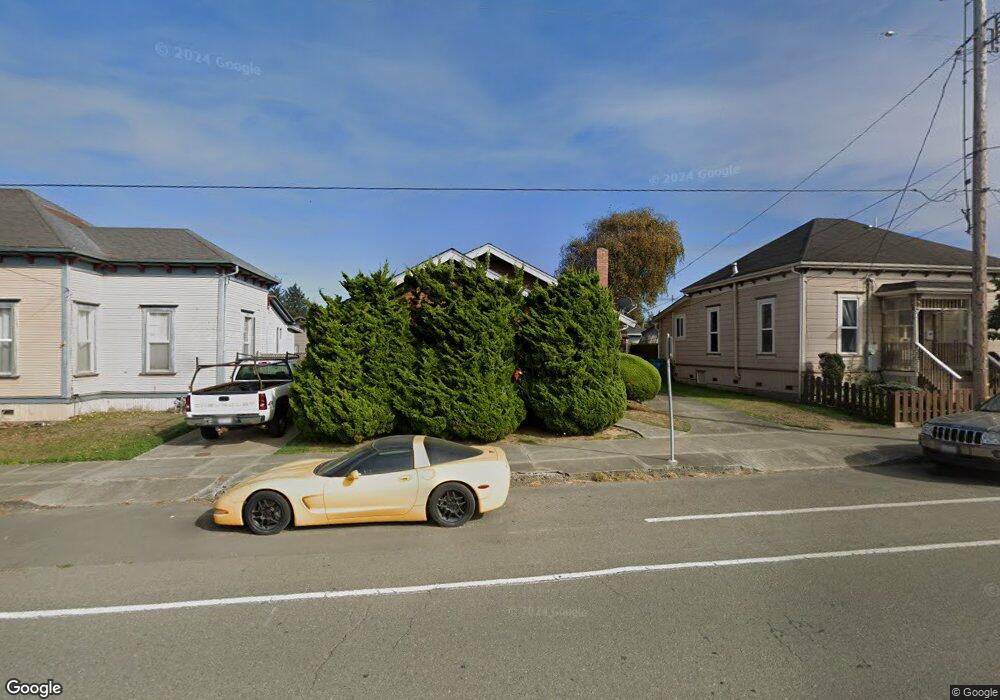
This home is located at 1803 J St, Eureka, CA 95501 and is currently estimated at $359,706, approximately $329 per square foot. 1803 J St is a home located in Humboldt County with nearby schools including Washington Elementary School, Catherine L. Zane Middle School, and Eureka Senior High School.
Ownership History
Date
Name
Owned For
Owner Type
Purchase Details
Closed on
Apr 27, 2022
Sold by
Donna Slater
Bought by
Donna Jean Slater Revocable Trust
Current Estimated Value
Purchase Details
Closed on
Feb 12, 2001
Sold by
Gabehart Kenneth J
Bought by
Slater Thomas and Slater Donna
Home Financials for this Owner
Home Financials are based on the most recent Mortgage that was taken out on this home.
Original Mortgage
$88,800
Interest Rate
7.12%
Mortgage Type
Purchase Money Mortgage
Purchase Details
Closed on
Mar 10, 1999
Sold by
Ziglar Kathleen H
Bought by
Gabehart Kenneth John
Create a Home Valuation Report for This Property
The Home Valuation Report is an in-depth analysis detailing your home's value as well as a comparison with similar homes in the area
Home Values in the Area
Average Home Value in this Area
Purchase History
| Date | Buyer | Sale Price | Title Company |
|---|---|---|---|
| Donna Jean Slater Revocable Trust | -- | Gale & Nielsen | |
| Slater Thomas | $93,500 | Humboldt Land Title Company | |
| Gabehart Kenneth John | -- | -- |
Source: Public Records
Mortgage History
| Date | Status | Borrower | Loan Amount |
|---|---|---|---|
| Previous Owner | Slater Thomas | $88,800 |
Source: Public Records
Tax History
| Year | Tax Paid | Tax Assessment Tax Assessment Total Assessment is a certain percentage of the fair market value that is determined by local assessors to be the total taxable value of land and additions on the property. | Land | Improvement |
|---|---|---|---|---|
| 2025 | $1,367 | $140,108 | $54,234 | $85,874 |
| 2024 | $1,367 | $137,362 | $53,171 | $84,191 |
| 2023 | $1,347 | $134,670 | $52,129 | $82,541 |
| 2022 | $1,397 | $132,030 | $51,107 | $80,923 |
| 2021 | $1,306 | $129,442 | $50,105 | $79,337 |
| 2020 | $1,296 | $128,116 | $49,592 | $78,524 |
| 2019 | $1,268 | $125,605 | $48,620 | $76,985 |
| 2018 | $1,247 | $123,143 | $47,667 | $75,476 |
| 2017 | $1,240 | $120,730 | $46,733 | $73,997 |
| 2016 | $1,238 | $118,364 | $45,817 | $72,547 |
| 2015 | $1,226 | $116,587 | $45,129 | $71,458 |
| 2014 | $1,145 | $114,304 | $44,245 | $70,059 |
Source: Public Records
Map
Nearby Homes
Your Personal Tour Guide
Ask me questions while you tour the home.