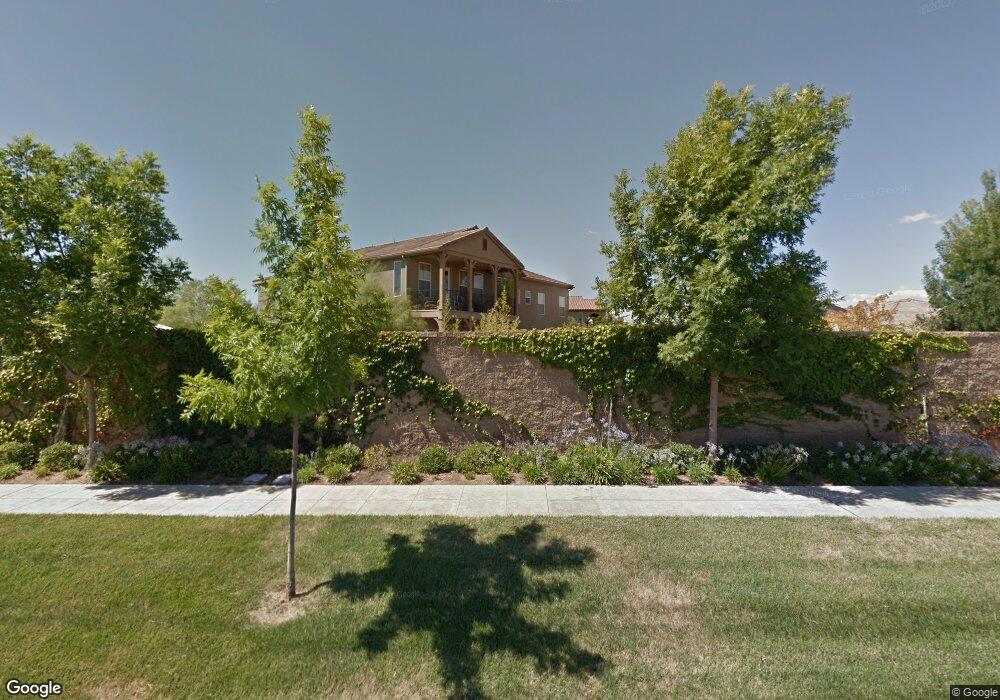
1803 N Moore Ln Clovis, CA 93619
Estimated Value: $778,000 - $959,000
4
Beds
4
Baths
3,856
Sq Ft
$228/Sq Ft
Est. Value
About This Home
This home is located at 1803 N Moore Ln, Clovis, CA 93619 and is currently estimated at $880,105, approximately $228 per square foot. 1803 N Moore Ln is a home located in Fresno County with nearby schools including Bud Rank Elementary School, Granite Ridge Intermediate School, and Clovis North High School.
Ownership History
Date
Name
Owned For
Owner Type
Purchase Details
Closed on
May 14, 2007
Sold by
5486 Enterprises Ii Lp
Bought by
Eliason John T and Eliason Stephanie Dee
Current Estimated Value
Home Financials for this Owner
Home Financials are based on the most recent Mortgage that was taken out on this home.
Original Mortgage
$627,950
Interest Rate
6.14%
Mortgage Type
Purchase Money Mortgage
Purchase Details
Closed on
May 10, 2007
Sold by
Eliason John T and Eliason Stephanie Dee
Bought by
Eliason John T and Eliason Stephanie Dee
Home Financials for this Owner
Home Financials are based on the most recent Mortgage that was taken out on this home.
Original Mortgage
$627,950
Interest Rate
6.14%
Mortgage Type
Purchase Money Mortgage
Purchase Details
Closed on
May 8, 2007
Sold by
Cvec Group Inc
Bought by
5486 Enterprises Ii Lp
Home Financials for this Owner
Home Financials are based on the most recent Mortgage that was taken out on this home.
Original Mortgage
$627,950
Interest Rate
6.14%
Mortgage Type
Purchase Money Mortgage
Create a Home Valuation Report for This Property
The Home Valuation Report is an in-depth analysis detailing your home's value as well as a comparison with similar homes in the area
Home Values in the Area
Average Home Value in this Area
Purchase History
| Date | Buyer | Sale Price | Title Company |
|---|---|---|---|
| Eliason John T | $785,000 | Financial Title Company | |
| Eliason John T | -- | Financial Title Company | |
| 5486 Enterprises Ii Lp | -- | Financial Title Company | |
| 5486 Enterprises Ii Lp | $206,000 | Financial Title Company |
Source: Public Records
Mortgage History
| Date | Status | Borrower | Loan Amount |
|---|---|---|---|
| Closed | Eliason John T | $627,950 |
Source: Public Records
Tax History
| Year | Tax Paid | Tax Assessment Tax Assessment Total Assessment is a certain percentage of the fair market value that is determined by local assessors to be the total taxable value of land and additions on the property. | Land | Improvement |
|---|---|---|---|---|
| 2025 | $4,570 | $352,544 | $97,611 | $254,933 |
| 2023 | $4,388 | $338,857 | $93,822 | $245,035 |
| 2022 | $4,325 | $332,214 | $91,983 | $240,231 |
| 2021 | $4,187 | $325,701 | $90,180 | $235,521 |
| 2020 | $4,166 | $322,363 | $89,256 | $233,107 |
| 2019 | $4,087 | $316,043 | $87,506 | $228,537 |
| 2018 | $3,999 | $309,847 | $85,791 | $224,056 |
| 2017 | $3,929 | $303,772 | $84,109 | $219,663 |
| 2016 | $3,801 | $297,816 | $82,460 | $215,356 |
| 2015 | $3,740 | $293,344 | $81,222 | $212,122 |
| 2014 | $3,671 | $287,598 | $79,631 | $207,967 |
Source: Public Records
Map
Nearby Homes
- 3560 Bloomfield Ln
- 3544 Prescott Ave
- 3664 Vermont Ln
- 1609 N Piccadilly Ln
- 3838 Moody Ln
- 1742 N Broadbent Ln
- 1814 N Notting Hill Ln
- 3855 Harlan Ranch Blvd
- 3531 Alcove Way
- 3396 Trenton Ave
- 3482 Elevations Way
- 1521 N Encoure Way
- 3708 Richmond Ave
- 1687 N Blackwood Ave
- 1675 N Blackwood Ave
- 3202 Everglade Ave
- 3940 Chessa Ln
- 1638 N Mcpherson Ln
- 4153 Serena Ave
- 3211 Salem Ave
- 1823 N Moore Ln
- 1806 N Dara Ave
- 1804 N Moore Ln
- 1816 N Dara Ave
- 1836 N Dara Ave
- 1814 N Moore Ln
- 1834 N Moore Ln
- 3655 Prescott Ave
- 3665 Prescott Ave
- 1811 N Sanders Ave
- 1844 N Moore Ln
- 1821 N Sanders Ave
- 3675 Prescott Ave
- 1831 N Sanders Ave
- 3704 Prescott Ave
- 3685 Prescott Ave
- 1841 N Sanders Ave
- 1864 N Moore Ln
- 1861 N Sanders Ave
- 3695 Prescott Ave
Your Personal Tour Guide
Ask me questions while you tour the home.