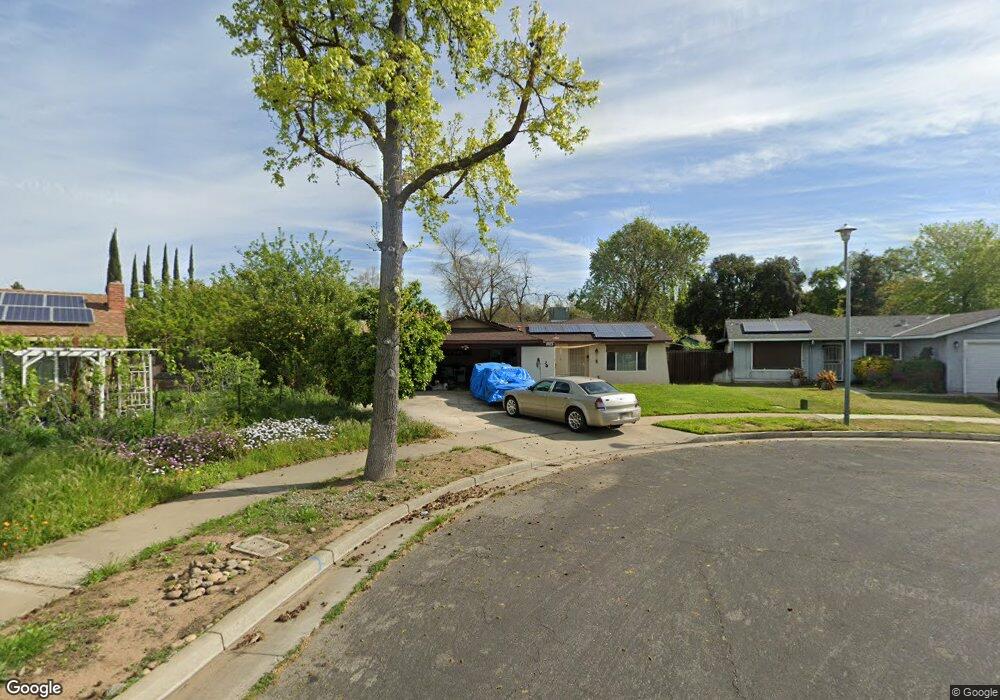
1803 Shadowbrook Dr Merced, CA 95348
Estimated Value: $338,000 - $355,000
3
Beds
2
Baths
1,310
Sq Ft
$263/Sq Ft
Est. Value
About This Home
This home is located at 1803 Shadowbrook Dr, Merced, CA 95348 and is currently estimated at $344,132, approximately $262 per square foot. 1803 Shadowbrook Dr is a home located in Merced County with nearby schools including Luther Burbank Elementary School, Tenaya Middle School, and Merced High School.
Ownership History
Date
Name
Owned For
Owner Type
Purchase Details
Closed on
Sep 9, 2005
Sold by
Riley Marylene
Bought by
Riley Earl Leonard and Riley Marylene
Current Estimated Value
Purchase Details
Closed on
Oct 23, 1998
Sold by
Riley Earl Leonard
Bought by
Riley Marylene
Home Financials for this Owner
Home Financials are based on the most recent Mortgage that was taken out on this home.
Original Mortgage
$87,935
Outstanding Balance
$18,772
Interest Rate
6.61%
Mortgage Type
FHA
Estimated Equity
$325,360
Purchase Details
Closed on
Oct 8, 1998
Sold by
Mason Roy A
Bought by
Riley Marylene
Home Financials for this Owner
Home Financials are based on the most recent Mortgage that was taken out on this home.
Original Mortgage
$87,935
Outstanding Balance
$18,772
Interest Rate
6.61%
Mortgage Type
FHA
Estimated Equity
$325,360
Create a Home Valuation Report for This Property
The Home Valuation Report is an in-depth analysis detailing your home's value as well as a comparison with similar homes in the area
Purchase History
| Date | Buyer | Sale Price | Title Company |
|---|---|---|---|
| Riley Earl Leonard | -- | Fidelity National Title Co | |
| Riley Marylene | -- | Transcounty Title Company | |
| Riley Marylene | $89,500 | Transcounty Title Company |
Source: Public Records
Mortgage History
| Date | Status | Borrower | Loan Amount |
|---|---|---|---|
| Open | Riley Marylene | $87,935 | |
| Closed | Riley Marylene | $9,742 |
Source: Public Records
Tax History
| Year | Tax Paid | Tax Assessment Tax Assessment Total Assessment is a certain percentage of the fair market value that is determined by local assessors to be the total taxable value of land and additions on the property. | Land | Improvement |
|---|---|---|---|---|
| 2025 | $1,409 | $140,288 | $47,020 | $93,268 |
| 2024 | $1,409 | $137,539 | $46,099 | $91,440 |
| 2023 | $950 | $94,044 | $45,196 | $48,848 |
| 2022 | $1,367 | $132,201 | $44,310 | $87,891 |
| 2021 | $1,363 | $129,610 | $43,442 | $86,168 |
| 2020 | $1,371 | $128,282 | $42,997 | $85,285 |
| 2019 | $1,349 | $125,767 | $42,154 | $83,613 |
| 2018 | $1,229 | $123,302 | $41,328 | $81,974 |
| 2017 | $1,274 | $120,885 | $40,518 | $80,367 |
| 2016 | $1,252 | $118,516 | $39,724 | $78,792 |
| 2015 | $1,231 | $116,737 | $39,128 | $77,609 |
| 2014 | $1,203 | $114,451 | $38,362 | $76,089 |
Source: Public Records
Map
Nearby Homes
- 1541 W North Bear Creek Dr
- 1648 W North Bear Creek Dr
- 1646 W North Bear Creek Dr
- 1963 Shadowbrook Dr
- 1973 Shadowbrook Dr
- 1656 W North Bear Creek Dr Unit 9
- 2500 N State Highway 59 Unit 36
- 2500 N State Highway 59 Unit 278
- 2500 N State Highway 59 Unit 239
- 2500 N State Highway 59 Unit 18
- 2500 N State Highway 59
- 1441 W 20th St
- 1664 W North Bear Creek Dr Unit 5
- 1438 W 19th St
- 1463 W 25th St
- 1482 Autry Way
- 2790 N State Highway 59
- 1145 W 22nd St
- 1044 W 20th St
- 1127 W 23rd St
- 2470 Crystal Springs Ave
- 1815 Shadowbrook Dr
- 1830 Brookside Dr
- 1820 Brookside Dr
- 1840 Brookside Dr
- 2460 Crystal Springs Ave
- 2460 Crystal Springs Ave
- 1823 Shadowbrook Dr
- 1854 Brookside Dr
- 1531 W North Bear Creek Dr
- 1535 W North Bear Creek Dr
- 1833 Shadowbrook Dr
- 2451 Crystal Springs Ave
- 1866 Brookside Dr
- 1831 Brookside Dr
- 1819 Brookside Dr
- 2440 Crystal Springs Ave
- 1843 Brookside Dr
- 1843 Shadowbrook Dr
- 2441 Crystal Springs Ave
Your Personal Tour Guide
Ask me questions while you tour the home.