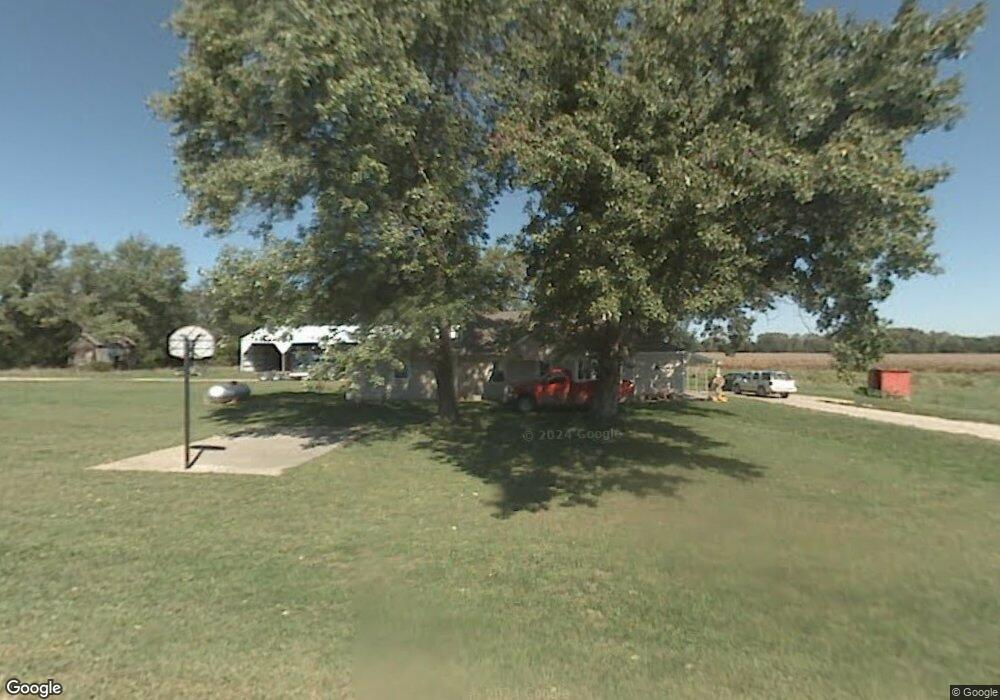
18038 262nd Rd Whiting, KS 66552
Estimated Value: $164,301 - $193,000
2
Beds
1
Bath
1,589
Sq Ft
$114/Sq Ft
Est. Value
About This Home
This home is located at 18038 262nd Rd, Whiting, KS 66552 and is currently estimated at $181,434, approximately $114 per square foot. 18038 262nd Rd is a home located in Jackson County with nearby schools including Jackson Heights Elementary School and Jackson Heights Middle/High School.
Create a Home Valuation Report for This Property
The Home Valuation Report is an in-depth analysis detailing your home's value as well as a comparison with similar homes in the area
Home Values in the Area
Average Home Value in this Area
Purchase History
| Date | Buyer | Sale Price | Title Company |
|---|---|---|---|
| Schumaker Dennis L | -- | -- |
Source: Public Records
Tax History Compared to Growth
Tax History
| Year | Tax Paid | Tax Assessment Tax Assessment Total Assessment is a certain percentage of the fair market value that is determined by local assessors to be the total taxable value of land and additions on the property. | Land | Improvement |
|---|---|---|---|---|
| 2025 | $1,653 | $15,082 | $3,398 | $11,684 |
| 2024 | $1,653 | $13,827 | $2,705 | $11,122 |
| 2023 | $1,628 | $13,087 | $2,702 | $10,385 |
| 2022 | $1,422 | $12,181 | $3,047 | $9,134 |
| 2021 | $1,422 | $10,534 | $2,699 | $7,835 |
| 2020 | $1,422 | $10,879 | $2,239 | $8,640 |
| 2019 | $1,370 | $10,284 | $2,233 | $8,051 |
| 2018 | $1,383 | $9,648 | $2,048 | $7,600 |
| 2017 | $1,383 | $10,029 | $1,358 | $8,671 |
| 2016 | $1,328 | $9,539 | $1,007 | $8,532 |
| 2015 | -- | $9,166 | $573 | $8,593 |
| 2014 | -- | $10,332 | $1,113 | $9,219 |
Source: Public Records
Map
Nearby Homes