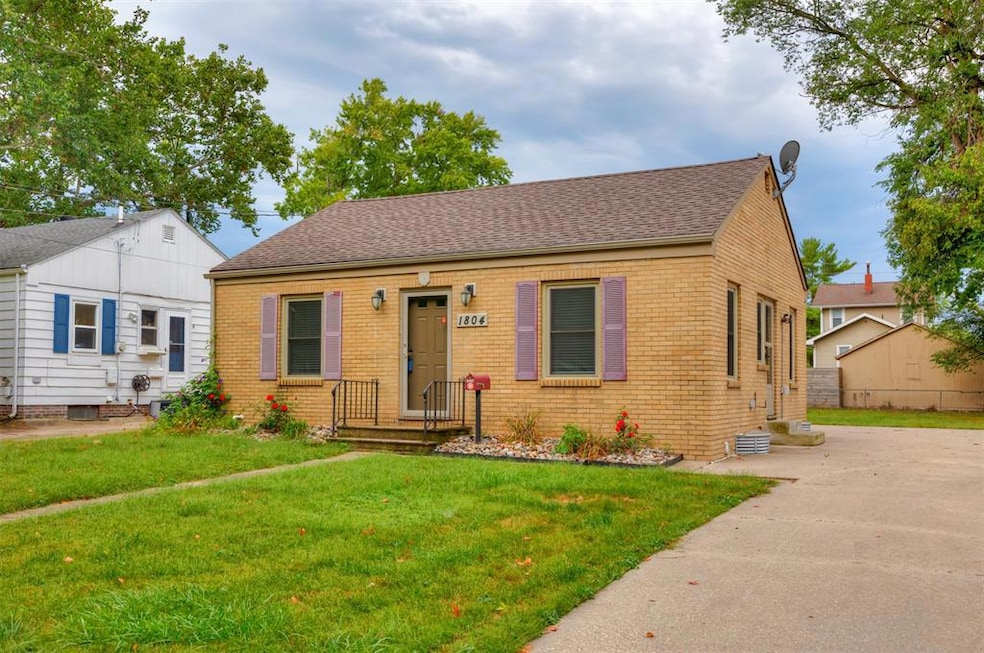
1804 47th St Des Moines, IA 50310
Waveland Park NeighborhoodEstimated payment $1,459/month
Highlights
- No HOA
- Bungalow
- Forced Air Heating and Cooling System
About This Home
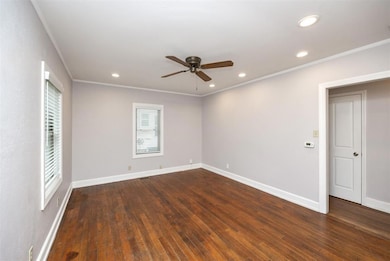
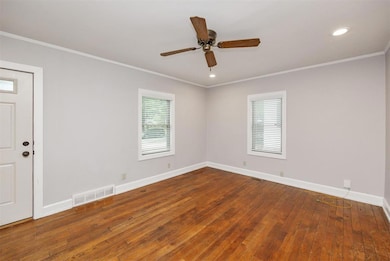
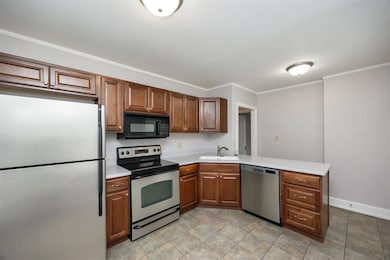
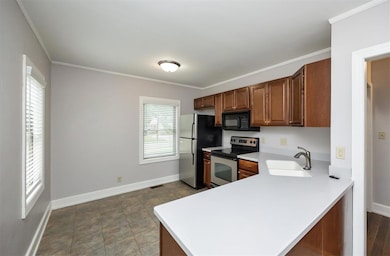
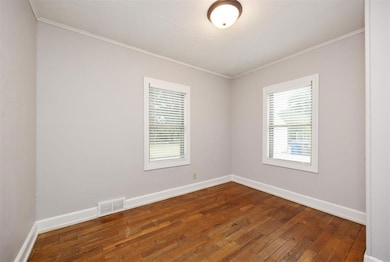
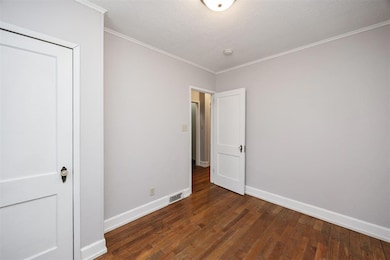
Move right in to this all brick bungalow in the popular Franklin Park neighborhood nestled between Beaverdale and Waterbury. You will love the hardwood floors and classic details that stretch through the home. The living room is a great size with large windows. A remodeled kitchen features nice appliances and plenty of storage. The 2 bedrooms also have nice hardwood and light. The full bath on the main floor has been remodeled and there is a newer 3/4 bath in the basement. The rest of the basement leaves plenty of opportunity for future finish. An added bonus is the large 2 car garage as well as a great backyard. With all new windows, updated roof and HVAC no big expenses are on the horizon. Located in an InvestDSM district future owners can receive grant money towards future improvements. Schedule a showing today!
Home Details
Home Type
- Single Family
Est. Annual Taxes
- $3,570
Year Built
- Built in 1940
Lot Details
- 7,000 Sq Ft Lot
- Lot Dimensions are 50x140
- Property is zoned N3B
Home Design
- 780 Sq Ft Home
- Bungalow
- Brick Exterior Construction
- Block Foundation
- Asphalt Shingled Roof
Kitchen
- Stove
- Microwave
- Dishwasher
Bedrooms and Bathrooms
- 2 Main Level Bedrooms
Laundry
- Dryer
- Washer
Parking
- 2 Car Detached Garage
- Driveway
Utilities
- Forced Air Heating and Cooling System
Additional Features
- Unfinished Basement
Community Details
- No Home Owners Association
Listing and Financial Details
- Assessor Parcel Number 10011674000000
Map
Home Values in the Area
Average Home Value in this Area
Tax History
| Year | Tax Paid | Tax Assessment Tax Assessment Total Assessment is a certain percentage of the fair market value that is determined by local assessors to be the total taxable value of land and additions on the property. | Land | Improvement |
|---|---|---|---|---|
| 2025 | $3,356 | $189,700 | $49,100 | $140,600 |
| 2024 | $3,356 | $170,600 | $43,500 | $127,100 |
| 2023 | $3,440 | $170,600 | $43,500 | $127,100 |
| 2022 | $3,414 | $146,000 | $38,500 | $107,500 |
| 2021 | $3,352 | $146,000 | $38,500 | $107,500 |
| 2020 | $3,482 | $134,300 | $35,100 | $99,200 |
| 2019 | $3,212 | $134,300 | $35,100 | $99,200 |
| 2018 | $3,180 | $119,500 | $30,700 | $88,800 |
| 2017 | $2,962 | $119,500 | $30,700 | $88,800 |
| 2016 | $2,886 | $109,500 | $27,500 | $82,000 |
| 2015 | $2,886 | $109,500 | $27,500 | $82,000 |
| 2014 | $2,874 | $108,200 | $25,400 | $82,800 |
Property History
| Date | Event | Price | List to Sale | Price per Sq Ft |
|---|---|---|---|---|
| 11/11/2025 11/11/25 | Price Changed | $219,900 | -2.3% | $282 / Sq Ft |
| 09/19/2025 09/19/25 | For Sale | $225,000 | -- | $288 / Sq Ft |
Purchase History
| Date | Type | Sale Price | Title Company |
|---|---|---|---|
| Warranty Deed | $50,000 | None Available | |
| Quit Claim Deed | -- | -- | |
| Quit Claim Deed | -- | -- |
Mortgage History
| Date | Status | Loan Amount | Loan Type |
|---|---|---|---|
| Previous Owner | $31,642 | Purchase Money Mortgage |
Source: Des Moines Area Association of REALTORS®
MLS Number: 726608
APN: 100-11674000000
Disclaimer: Certain information contained herein is derived from information provided by parties other than Homes.com. All information provided is deemed reliable, but is not guaranteed to be accurate and should be independently verified.
![]() IDX information is provided exclusively for personal, non-commercial use, and may not be used for any purpose other than to identify prospective properties consumers may be interested in purchasing. Information is deemed reliable but not guaranteed.
IDX information is provided exclusively for personal, non-commercial use, and may not be used for any purpose other than to identify prospective properties consumers may be interested in purchasing. Information is deemed reliable but not guaranteed.
- 4925 Franklin Ave
- 5113 Lincoln Ave Unit 5113
- 2107 52nd St Unit 2017
- 2300 Beaver Ave
- 1539 56th St
- 5513 Forest Ave
- 1512 Beaver Ave
- 2923 49th Place
- 4010 University
- 5902 Hickman Rd
- 1417 Beaver Ave
- 1229 Merle Hay Rd
- 3721 Cottage Grove Ave Unit 7
- 1260 34th St
- 5813 New York Ave
- 3201 Forest Ave
- 1219 34th St
- 3330 52nd St
- 2004 63rd St
- 3103-3109 Forest Ave
