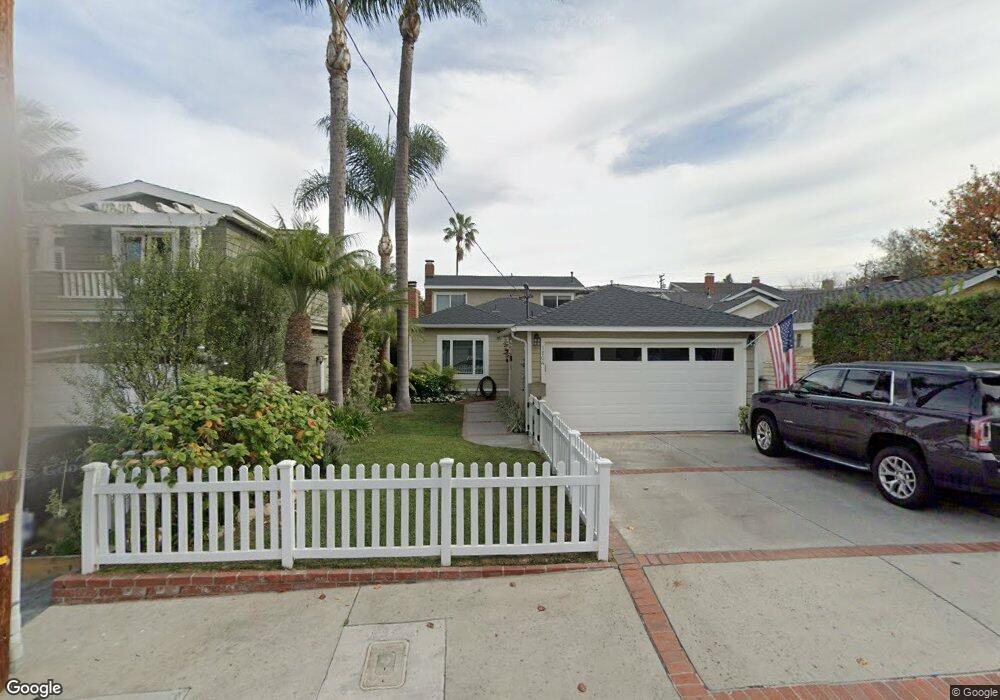
1804 Elm Ave Manhattan Beach, CA 90266
Estimated Value: $2,159,000 - $3,119,000
3
Beds
3
Baths
1,752
Sq Ft
$1,473/Sq Ft
Est. Value
About This Home
This home is located at 1804 Elm Ave, Manhattan Beach, CA 90266 and is currently estimated at $2,580,154, approximately $1,472 per square foot. 1804 Elm Ave is a home located in Los Angeles County with nearby schools including Pacific Elementary School, Manhattan Beach Middle School, and Mira Costa High School.
Ownership History
Date
Name
Owned For
Owner Type
Purchase Details
Closed on
Dec 12, 2011
Sold by
Movius Matthew J
Bought by
Peck Matthew J and Movius Margaret M
Current Estimated Value
Home Financials for this Owner
Home Financials are based on the most recent Mortgage that was taken out on this home.
Original Mortgage
$625,500
Outstanding Balance
$428,910
Interest Rate
4.06%
Mortgage Type
New Conventional
Estimated Equity
$2,151,244
Purchase Details
Closed on
Dec 8, 2011
Sold by
Movius Margaret M
Bought by
Peck Matthew J and Movius Margaret M
Home Financials for this Owner
Home Financials are based on the most recent Mortgage that was taken out on this home.
Original Mortgage
$625,500
Outstanding Balance
$428,910
Interest Rate
4.06%
Mortgage Type
New Conventional
Estimated Equity
$2,151,244
Purchase Details
Closed on
Sep 24, 2010
Sold by
Peck Matthew J
Bought by
Peck Matthew J and Movius Margaret M
Home Financials for this Owner
Home Financials are based on the most recent Mortgage that was taken out on this home.
Original Mortgage
$663,000
Interest Rate
4.35%
Mortgage Type
New Conventional
Purchase Details
Closed on
May 20, 2010
Sold by
Peck Matthew J
Bought by
Peck Matthew J and Movius Margaret M
Purchase Details
Closed on
Jun 29, 1998
Sold by
Skelly Lisa A
Bought by
Skelly Timothy J
Home Financials for this Owner
Home Financials are based on the most recent Mortgage that was taken out on this home.
Original Mortgage
$100,000
Interest Rate
7%
Mortgage Type
Stand Alone Second
Purchase Details
Closed on
Jun 23, 1998
Sold by
Skelly Timothy J
Bought by
Peck Matthew J and Movius Margaret M
Home Financials for this Owner
Home Financials are based on the most recent Mortgage that was taken out on this home.
Original Mortgage
$100,000
Interest Rate
7%
Mortgage Type
Stand Alone Second
Purchase Details
Closed on
Oct 27, 1993
Sold by
Skelly Timothy J
Bought by
Skelly Timothy J
Home Financials for this Owner
Home Financials are based on the most recent Mortgage that was taken out on this home.
Original Mortgage
$107,464
Interest Rate
6.89%
Create a Home Valuation Report for This Property
The Home Valuation Report is an in-depth analysis detailing your home's value as well as a comparison with similar homes in the area
Home Values in the Area
Average Home Value in this Area
Purchase History
| Date | Buyer | Sale Price | Title Company |
|---|---|---|---|
| Peck Matthew J | -- | None Available | |
| Peck Matthew J | -- | Pacific Coast Title | |
| Peck Matthew J | -- | Chicago Title | |
| Peck Matthew J | -- | Chicago Title | |
| Peck Matthew J | -- | None Available | |
| Skelly Timothy J | -- | Southland Title Corporation | |
| Peck Matthew J | $668,000 | Southland Title Corporation | |
| Skelly Timothy J | -- | -- |
Source: Public Records
Mortgage History
| Date | Status | Borrower | Loan Amount |
|---|---|---|---|
| Open | Peck Matthew J | $625,500 | |
| Closed | Peck Matthew J | $663,000 | |
| Closed | Skelly Timothy J | $100,000 | |
| Closed | Peck Matthew J | $534,400 | |
| Previous Owner | Skelly Timothy J | $107,464 |
Source: Public Records
Tax History Compared to Growth
Tax History
| Year | Tax Paid | Tax Assessment Tax Assessment Total Assessment is a certain percentage of the fair market value that is determined by local assessors to be the total taxable value of land and additions on the property. | Land | Improvement |
|---|---|---|---|---|
| 2025 | $12,022 | $1,047,217 | $804,860 | $242,357 |
| 2024 | $12,022 | $1,026,684 | $789,079 | $237,605 |
| 2023 | $11,675 | $1,006,554 | $773,607 | $232,947 |
| 2022 | $11,476 | $986,819 | $758,439 | $228,380 |
| 2021 | $11,311 | $967,470 | $743,568 | $223,902 |
| 2019 | $11,012 | $938,776 | $721,514 | $217,262 |
| 2018 | $10,771 | $920,369 | $707,367 | $213,002 |
| 2016 | $9,901 | $884,632 | $679,900 | $204,732 |
| 2015 | $9,697 | $871,345 | $669,688 | $201,657 |
| 2014 | $9,567 | $854,277 | $656,570 | $197,707 |
Source: Public Records
Map
Nearby Homes