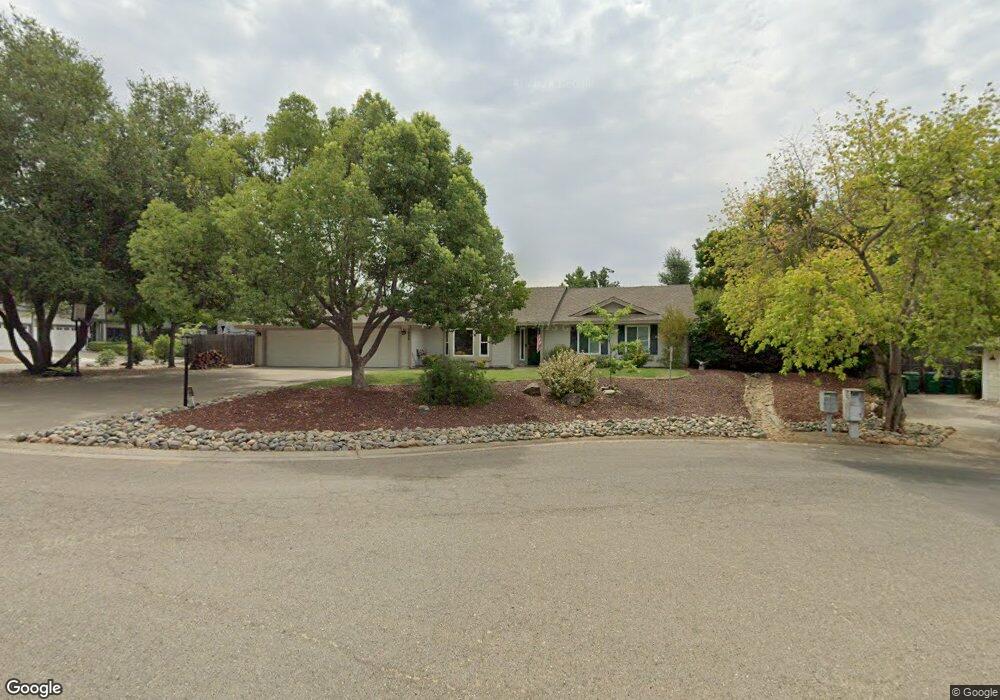
1804 Rochhampton Place El Dorado Hills, CA 95762
Estimated Value: $582,000 - $752,000
3
Beds
2
Baths
1,654
Sq Ft
$419/Sq Ft
Est. Value
About This Home
This home is located at 1804 Rochhampton Place, El Dorado Hills, CA 95762 and is currently estimated at $692,703, approximately $418 per square foot. 1804 Rochhampton Place is a home located in El Dorado County with nearby schools including Silva Valley Elementary School, Rolling Hills Middle School, and Oak Ridge High School.
Ownership History
Date
Name
Owned For
Owner Type
Purchase Details
Closed on
Mar 1, 2018
Sold by
Gausman Randall and Gausman Michael
Bought by
Wadiak Janelle and Wadiak Nicholas
Current Estimated Value
Home Financials for this Owner
Home Financials are based on the most recent Mortgage that was taken out on this home.
Original Mortgage
$109,700
Outstanding Balance
$93,235
Interest Rate
4.04%
Mortgage Type
New Conventional
Estimated Equity
$599,468
Purchase Details
Closed on
Jun 6, 2007
Sold by
Gausman William D and Gausman Gloria K
Bought by
Gausman William D and Gausman Gloria K
Home Financials for this Owner
Home Financials are based on the most recent Mortgage that was taken out on this home.
Original Mortgage
$544,185
Interest Rate
5.98%
Mortgage Type
Reverse Mortgage Home Equity Conversion Mortgage
Purchase Details
Closed on
Aug 14, 2006
Sold by
Gausman William D and Gausman Gloria K
Bought by
Gausman William D and Gausman Gloria K
Create a Home Valuation Report for This Property
The Home Valuation Report is an in-depth analysis detailing your home's value as well as a comparison with similar homes in the area
Home Values in the Area
Average Home Value in this Area
Purchase History
| Date | Buyer | Sale Price | Title Company |
|---|---|---|---|
| Wadiak Janelle | $505,000 | Fidelity National Title | |
| Gausman William D | -- | Lenders Choice Title Company | |
| Gausman William D | -- | None Available |
Source: Public Records
Mortgage History
| Date | Status | Borrower | Loan Amount |
|---|---|---|---|
| Open | Wadiak Janelle | $109,700 | |
| Previous Owner | Gausman William D | $544,185 |
Source: Public Records
Tax History Compared to Growth
Tax History
| Year | Tax Paid | Tax Assessment Tax Assessment Total Assessment is a certain percentage of the fair market value that is determined by local assessors to be the total taxable value of land and additions on the property. | Land | Improvement |
|---|---|---|---|---|
| 2025 | $6,075 | $574,597 | $201,392 | $373,205 |
| 2024 | $6,075 | $563,332 | $197,444 | $365,888 |
| 2023 | $5,804 | $552,287 | $193,573 | $358,714 |
| 2022 | $5,716 | $541,459 | $189,778 | $351,681 |
| 2021 | $5,727 | $530,843 | $186,057 | $344,786 |
| 2020 | $5,699 | $525,401 | $184,150 | $341,251 |
| 2019 | $5,530 | $515,100 | $180,540 | $334,560 |
| 2018 | $2,383 | $206,880 | $50,451 | $156,429 |
| 2017 | $2,185 | $202,824 | $49,462 | $153,362 |
| 2016 | $2,155 | $198,848 | $48,493 | $150,355 |
| 2015 | $2,131 | $195,863 | $47,765 | $148,098 |
| 2014 | $2,131 | $192,028 | $46,830 | $145,198 |
Source: Public Records
Map
Nearby Homes
- 3452 Tah Nee Way
- 4165 Brisbane Cir
- 4304 Brisbane Cir
- 3870 Meadow Wood Dr
- 3789 Pardee Ct
- 4008 Avellano Dr
- 326 Endless Ct
- 3987 Meadow Wood Dr
- 5528 Sur Mer Dr
- 5563 Sur Mer Dr
- 4893 Gresham Dr
- 5520 Sur Mer Dr
- 1780 Darwin Way
- 4963 Breese Cir
- 4926 Breese Cir
- 4035 Meadow Wood Dr
- 5155 Breese Cir
- 4934 Breese Cir
- 5457 Sur Mer Dr
- 3197 Warren Ln
- 3154 Clermont Way
- 1794 Rochhampton Place
- 1805 Rochhampton Place
- 3160 Clermont Way
- 3145 Clermont Way
- 3149 Clermont Way
- 3141 Clermont Way
- 3153 Clermont Way
- 1795 Rochhampton Place
- 3133 Clermont Way
- 1801 Rochhampton Place
- 1189 Ravenshoe Way
- 3127 Clermont Way
- 3166 Clermont Way
- 1713 Rolleston Place
- 3250 Williston Way
- 3242 Williston Way
- 3119 Clermont Way
- 3234 Williston Way
- 3254 Williston Way