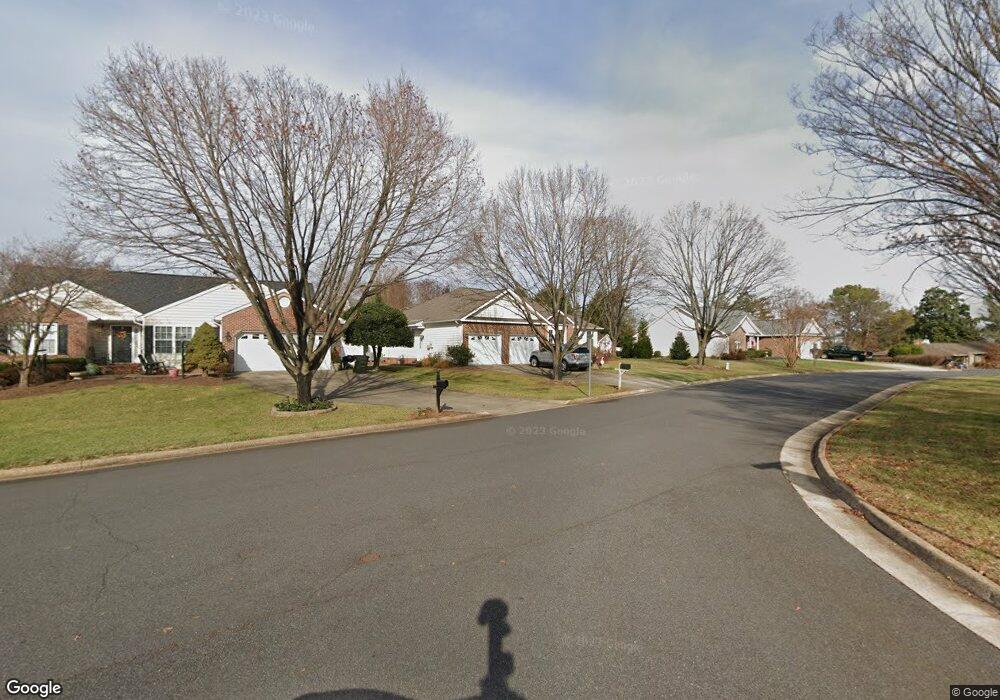
1804 Stoneybrook Ln Culpeper, VA 22701
Estimated Value: $512,097 - $729,000
3
Beds
2
Baths
2,201
Sq Ft
$280/Sq Ft
Est. Value
About This Home
This home is located at 1804 Stoneybrook Ln, Culpeper, VA 22701 and is currently estimated at $617,024, approximately $280 per square foot. 1804 Stoneybrook Ln is a home located in Culpeper County with nearby schools including Farmington Elementary School, Floyd T. Binns Middle School, and Eastern View High School.
Ownership History
Date
Name
Owned For
Owner Type
Purchase Details
Closed on
Feb 26, 2011
Sold by
Streets William R
Bought by
Laski Paul E
Current Estimated Value
Purchase Details
Closed on
Feb 26, 2010
Sold by
Streets William R
Bought by
Laski Paul E
Purchase Details
Closed on
Jul 31, 2009
Sold by
Cooke Edward J
Bought by
May Charles
Home Financials for this Owner
Home Financials are based on the most recent Mortgage that was taken out on this home.
Original Mortgage
$50,000
Interest Rate
5.36%
Mortgage Type
New Conventional
Purchase Details
Closed on
Dec 13, 2006
Sold by
Riggs Mark
Bought by
Groves Lesbia
Purchase Details
Closed on
Mar 23, 2001
Sold by
Hudson Bertha W
Bought by
Streets William R
Home Financials for this Owner
Home Financials are based on the most recent Mortgage that was taken out on this home.
Original Mortgage
$200,000
Interest Rate
6.96%
Create a Home Valuation Report for This Property
The Home Valuation Report is an in-depth analysis detailing your home's value as well as a comparison with similar homes in the area
Home Values in the Area
Average Home Value in this Area
Purchase History
| Date | Buyer | Sale Price | Title Company |
|---|---|---|---|
| Laski Paul E | $335,000 | -- | |
| Laski Paul E | $335,000 | -- | |
| May Charles | $190,000 | -- | |
| Groves Lesbia | $321,000 | -- | |
| Streets William R | $260,000 | -- |
Source: Public Records
Mortgage History
| Date | Status | Borrower | Loan Amount |
|---|---|---|---|
| Previous Owner | May Charles | $50,000 | |
| Previous Owner | Streets William R | $200,000 |
Source: Public Records
Tax History Compared to Growth
Tax History
| Year | Tax Paid | Tax Assessment Tax Assessment Total Assessment is a certain percentage of the fair market value that is determined by local assessors to be the total taxable value of land and additions on the property. | Land | Improvement |
|---|---|---|---|---|
| 2024 | $2,463 | $459,500 | $108,600 | $350,900 |
| 2023 | $2,417 | $459,500 | $108,600 | $350,900 |
| 2022 | $2,203 | $400,500 | $85,100 | $315,400 |
| 2021 | $2,531 | $400,500 | $85,100 | $315,400 |
| 2020 | $1,982 | $319,600 | $76,100 | $243,500 |
| 2019 | $1,982 | $319,600 | $76,100 | $243,500 |
| 2018 | $2,215 | $330,600 | $76,100 | $254,500 |
| 2017 | $2,215 | $330,600 | $76,100 | $254,500 |
| 2016 | $2,420 | $331,500 | $77,000 | $254,500 |
| 2015 | $2,420 | $331,500 | $77,000 | $254,500 |
| 2014 | $2,698 | $281,000 | $62,000 | $219,000 |
Source: Public Records
Map
Nearby Homes
- 660 Country Club Rd
- 0 Mulligan Way Hopewell Plan
- 0 Mulligan Way Hemingway Plan
- 400 Greens Ct
- 0 Mulligan Way Arlington Plan Way
- 2000 Divot Dr
- 2009 Divot Dr
- 2005 Divot Dr
- 1820 Mulligan Way
- 1925 Sunset Ln
- 2008 Divot Dr
- 2004 Divot Dr
- 1817 Mulligan Way
- 2020 Golf Dr
- 1908 Sunset Ln
- 2021 Golf Dr
- 0 Mulligan Way Coronado Plan Unit VACU2011704
- 2036 Golf Dr
- 529 Tara Ct
- 2009 Divot Dr
- 1808 Stoneybrook Ln
- 1800 Stoneybrook Ln
- 1813 Fairway Ct
- 645 Country Club Rd
- 1032 Ridgemere Ln
- 1817 Fairway Ct
- 637 Country Club Rd
- 1809 Fairway Ct
- 1812 Stoneybrook Ln
- 17361 Country Club Rd
- 1025 Ridgemere Ln
- 1028 Ridgemere Ln
- 1032 Golf Dr
- 1821 Fairway Ct
- 633 Country Club Rd
- 1640 Stoneybrook Ln
- 1024 Golf Dr
- 1804 Fairway Ct
- 1021 Ridgemere Ln
- 1825 Fairway Ct