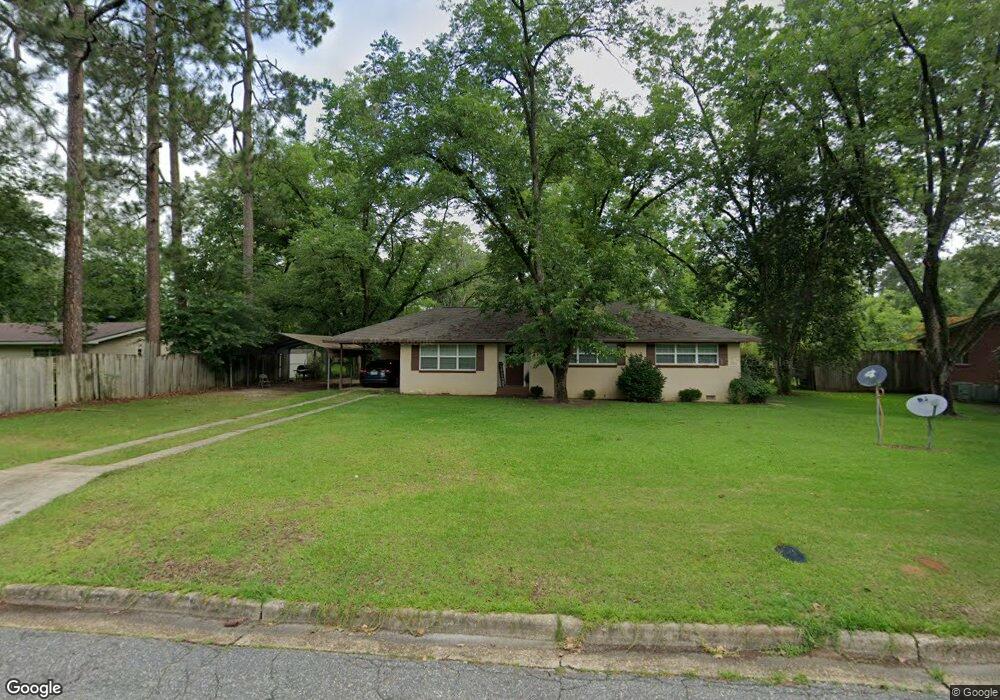
1805 Acker Dr Albany, GA 31707
Green Acres NeighborhoodEstimated Value: $145,202 - $168,000
3
Beds
2
Baths
1,435
Sq Ft
$110/Sq Ft
Est. Value
About This Home
This home is located at 1805 Acker Dr, Albany, GA 31707 and is currently estimated at $157,301, approximately $109 per square foot. 1805 Acker Dr is a home located in Dougherty County with nearby schools including Sherwood Acres Elementary School, Merry Acres Middle School, and Westover High School.
Ownership History
Date
Name
Owned For
Owner Type
Purchase Details
Closed on
Nov 28, 2011
Sold by
Taylor Peter
Bought by
Wright Latolya
Current Estimated Value
Home Financials for this Owner
Home Financials are based on the most recent Mortgage that was taken out on this home.
Original Mortgage
$85,769
Outstanding Balance
$58,062
Interest Rate
4.25%
Mortgage Type
FHA
Estimated Equity
$99,239
Purchase Details
Closed on
Aug 13, 2010
Sold by
Dirmitt Cynthia Dale
Bought by
Taylor Peter
Purchase Details
Closed on
Jan 9, 2003
Sold by
Mitchell Frances F
Bought by
Hagains Dorothy R
Purchase Details
Closed on
Jan 6, 2000
Sold by
Hagains Dorothy R and Mitchell Frances F
Bought by
Hagains Dorothy R and Mitch Frances F
Purchase Details
Closed on
Feb 15, 1997
Sold by
Spivey Harlon P
Bought by
Hagains Dorothy R and Mitchell France
Purchase Details
Closed on
Oct 1, 1955
Bought by
Spivey H P
Create a Home Valuation Report for This Property
The Home Valuation Report is an in-depth analysis detailing your home's value as well as a comparison with similar homes in the area
Home Values in the Area
Average Home Value in this Area
Purchase History
| Date | Buyer | Sale Price | Title Company |
|---|---|---|---|
| Wright Latolya | $88,000 | -- | |
| Taylor Peter | $25,000 | -- | |
| Hagains Dorothy R | -- | -- | |
| Hagains Dorothy R | -- | -- | |
| Hagains Dorothy R | $54,000 | -- | |
| Spivey H P | -- | -- |
Source: Public Records
Mortgage History
| Date | Status | Borrower | Loan Amount |
|---|---|---|---|
| Open | Wright Latolya | $85,769 |
Source: Public Records
Tax History
| Year | Tax Paid | Tax Assessment Tax Assessment Total Assessment is a certain percentage of the fair market value that is determined by local assessors to be the total taxable value of land and additions on the property. | Land | Improvement |
|---|---|---|---|---|
| 2025 | $1,874 | $37,000 | $9,240 | $27,760 |
| 2024 | $1,874 | $37,000 | $9,240 | $27,760 |
| 2023 | $1,724 | $37,000 | $9,240 | $27,760 |
| 2022 | $1,730 | $37,000 | $9,240 | $27,760 |
| 2021 | $1,604 | $37,000 | $9,240 | $27,760 |
| 2020 | $1,608 | $37,000 | $9,240 | $27,760 |
| 2019 | $1,614 | $37,000 | $9,240 | $27,760 |
| 2018 | $1,621 | $37,000 | $9,240 | $27,760 |
| 2017 | $1,510 | $37,000 | $9,240 | $27,760 |
| 2016 | $1,511 | $37,000 | $9,240 | $27,760 |
| 2015 | $1,515 | $37,000 | $9,240 | $27,760 |
| 2014 | $1,552 | $38,400 | $10,640 | $27,760 |
Source: Public Records
Map
Nearby Homes
- 1810 Sharon Ave
- 1801 Acker Dr
- 1705 Sharon Ave
- 2300 Hilltop Dr
- 1701 Sharon Dr
- 2402 Hilltop Dr
- 2004 Gail Ave
- 1617 Gail Ave
- 2016 Gail Ave
- 1512 Pearl Ave
- 1409 Sharon Ave
- 2502 Burnwyck Ct
- 1907 Homewood Dr
- 2102 Acker Dr
- 1907 Edgewood Ln
- 2526 Hilltop Dr
- 2528 Hilltop Dr
- 2530 Hilltop Dr
- 1801 Oak Glen Ln
- 1402 Gary Ave
Your Personal Tour Guide
Ask me questions while you tour the home.