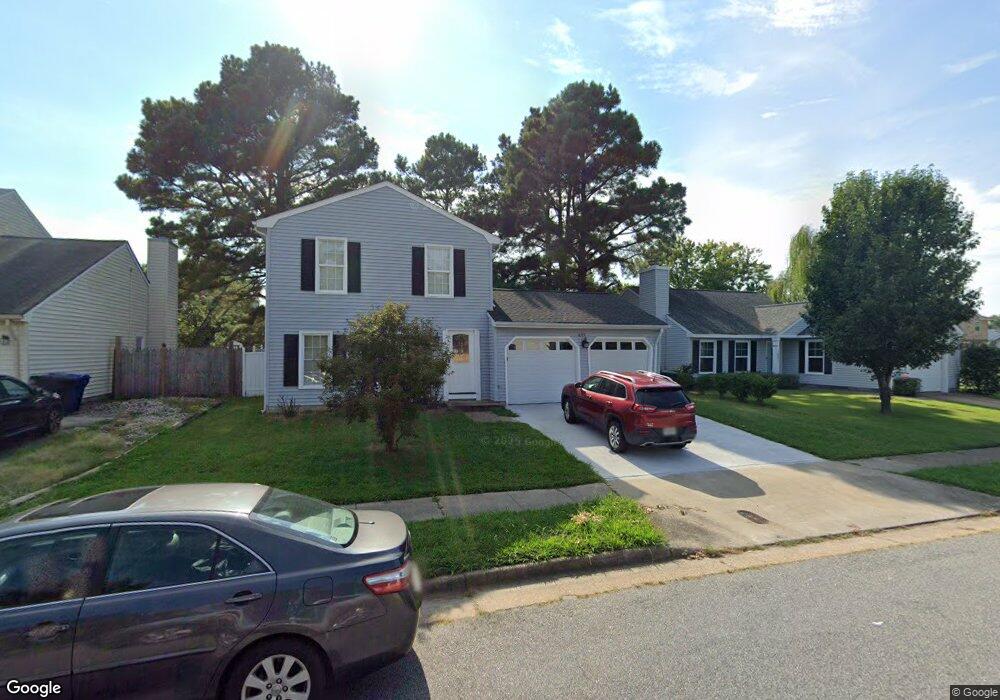
1805 Bloomfield Dr Virginia Beach, VA 23453
Dam Neck NeighborhoodEstimated Value: $424,229 - $475,000
3
Beds
3
Baths
1,644
Sq Ft
$269/Sq Ft
Est. Value
About This Home
This home is located at 1805 Bloomfield Dr, Virginia Beach, VA 23453 and is currently estimated at $441,557, approximately $268 per square foot. 1805 Bloomfield Dr is a home located in Virginia Beach City with nearby schools including Landstown Elementary School, Landstown Middle School, and Landstown High School.
Ownership History
Date
Name
Owned For
Owner Type
Purchase Details
Closed on
Jul 24, 2023
Sold by
Lsf8 Master Participation Trust
Bought by
Rogers Jovan and Rogers Latoya
Current Estimated Value
Home Financials for this Owner
Home Financials are based on the most recent Mortgage that was taken out on this home.
Original Mortgage
$387,746
Outstanding Balance
$378,531
Interest Rate
6.81%
Mortgage Type
FHA
Estimated Equity
$63,026
Purchase Details
Closed on
Jan 11, 2019
Sold by
Alg Trustee Llc
Bought by
Us Bank Trust Na and Lsf8 Master Participation Trust
Purchase Details
Closed on
Dec 7, 2017
Sold by
Joe Kirt T
Bought by
Nenstiel Jeffrey James
Purchase Details
Closed on
Mar 24, 2000
Sold by
Sec Veterans Affairs
Bought by
Joe Kirt T
Home Financials for this Owner
Home Financials are based on the most recent Mortgage that was taken out on this home.
Original Mortgage
$110,000
Interest Rate
8.4%
Purchase Details
Closed on
Nov 23, 1999
Sold by
Wood Stephen B
Bought by
Veterans Affairs
Create a Home Valuation Report for This Property
The Home Valuation Report is an in-depth analysis detailing your home's value as well as a comparison with similar homes in the area
Home Values in the Area
Average Home Value in this Area
Purchase History
| Date | Buyer | Sale Price | Title Company |
|---|---|---|---|
| Rogers Jovan | $394,900 | None Listed On Document | |
| Us Bank Trust Na | $300,885 | None Available | |
| Nenstiel Jeffrey James | -- | None Available | |
| Joe Kirt T | $113,500 | -- | |
| Veterans Affairs | $96,454 | -- |
Source: Public Records
Mortgage History
| Date | Status | Borrower | Loan Amount |
|---|---|---|---|
| Open | Rogers Jovan | $387,746 | |
| Previous Owner | Joe Kirt T | $110,000 |
Source: Public Records
Tax History Compared to Growth
Tax History
| Year | Tax Paid | Tax Assessment Tax Assessment Total Assessment is a certain percentage of the fair market value that is determined by local assessors to be the total taxable value of land and additions on the property. | Land | Improvement |
|---|---|---|---|---|
| 2025 | $3,577 | $377,400 | $160,000 | $217,400 |
| 2024 | $3,577 | $368,800 | $160,000 | $208,800 |
| 2023 | $3,337 | $337,100 | $130,000 | $207,100 |
| 2022 | $3,110 | $314,100 | $107,000 | $207,100 |
| 2021 | $2,682 | $270,900 | $90,000 | $180,900 |
| 2020 | $2,633 | $258,800 | $90,000 | $168,800 |
| 2019 | $2,583 | $245,100 | $88,000 | $157,100 |
| 2018 | $2,457 | $245,100 | $88,000 | $157,100 |
| 2017 | $2,454 | $244,800 | $88,000 | $156,800 |
| 2016 | $2,334 | $235,800 | $86,000 | $149,800 |
| 2015 | $2,305 | $232,800 | $85,800 | $147,000 |
| 2014 | $1,911 | $233,200 | $85,800 | $147,400 |
Source: Public Records
Map
Nearby Homes
- 3104 Bloomfield Ct
- 3060 Glastonbury Dr
- 1804 Monet Ct
- 3005 Winterberry Ln
- 1812 Monet Ct
- 3129 Damascus Trail
- 2020 Aloma Dr
- 1808 Allaben Ct
- 2946 Sugar Maple Dr
- 2921 Bluegrass Ln
- 1721 Purpose Dr
- 1709 Purpose Dr
- 1713 Schooner Strait Ct
- 1729 Chestwood Dr
- 2812 Pleasant Acres Dr
- 1909 Maple Shade Dr
- 2748 Christopher Farms Dr
- 3565 Purebred Dr
- 2604 Saint Regis Ln
- 2516 Placid Place
- 1809 Bloomfield Dr
- 1801 Bloomfield Dr
- 3109 Monet Dr
- 1813 Bloomfield Dr
- 3105 Monet Dr
- 3077 Monet Dr
- 3032 Williston Dr
- 3113 Monet Dr
- 3113 Monet Dr Unit Dr
- 1817 Bloomfield Dr
- 3100 Monet Dr
- 3104 Monet Dr
- 3073 Monet Dr
- 3028 Williston Dr
- 3108 Monet Dr
- 3080 Monet Dr
- 3112 Monet Dr
- 3108 Bloomfield Ct
- 3076 Monet Dr
- 1821 Bloomfield Dr