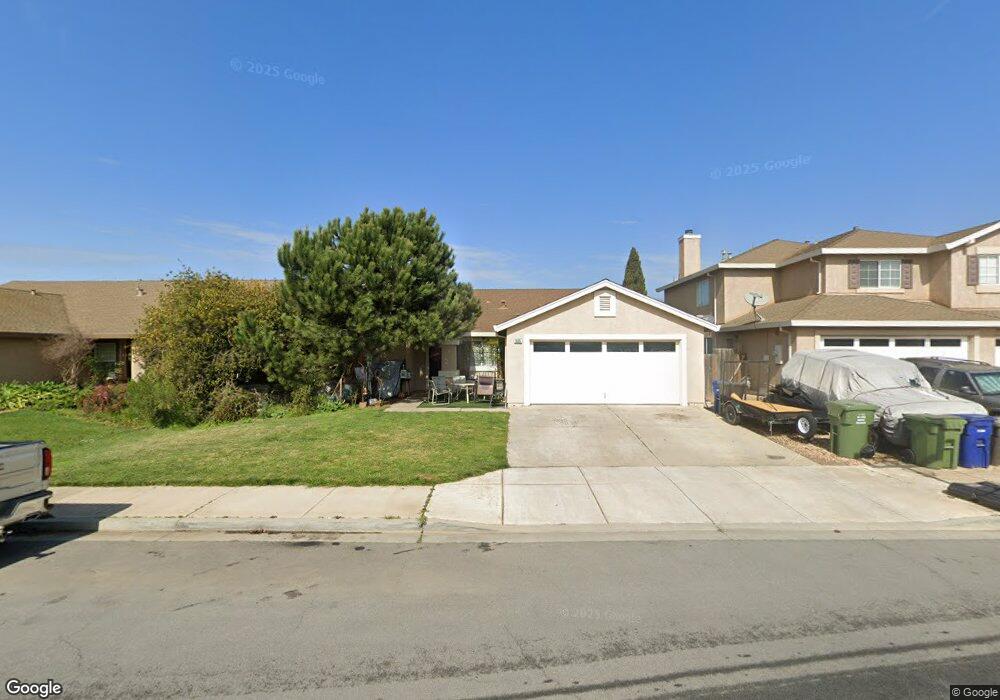
1805 Chablis Way Gonzales, CA 93926
Estimated Value: $689,664 - $816,000
4
Beds
2
Baths
2,022
Sq Ft
$374/Sq Ft
Est. Value
About This Home
This home is located at 1805 Chablis Way, Gonzales, CA 93926 and is currently estimated at $755,916, approximately $373 per square foot. 1805 Chablis Way is a home located in Monterey County with nearby schools including La Gloria Elementary School, Fairview Middle School, and Gonzales High School.
Ownership History
Date
Name
Owned For
Owner Type
Purchase Details
Closed on
Apr 14, 2011
Sold by
Aguilar J D and Aguilar Ginger L
Bought by
Aguilar J D and Aguilar Ginger L
Current Estimated Value
Purchase Details
Closed on
Apr 23, 2009
Sold by
Us Bank National Association
Bought by
Aguilar Jd and Aguilar Ginger
Purchase Details
Closed on
Nov 9, 2008
Sold by
Chaidez Juan M
Bought by
Us Bank National Association
Purchase Details
Closed on
Oct 2, 2007
Sold by
Chaidez Juan M
Bought by
Chaidez Juan M and Chaidez Manuel
Purchase Details
Closed on
May 21, 2003
Sold by
Dkb Homes Llc
Bought by
Chaidez Juan M
Home Financials for this Owner
Home Financials are based on the most recent Mortgage that was taken out on this home.
Original Mortgage
$267,000
Interest Rate
6.25%
Mortgage Type
Purchase Money Mortgage
Create a Home Valuation Report for This Property
The Home Valuation Report is an in-depth analysis detailing your home's value as well as a comparison with similar homes in the area
Home Values in the Area
Average Home Value in this Area
Purchase History
| Date | Buyer | Sale Price | Title Company |
|---|---|---|---|
| Aguilar J D | -- | None Available | |
| Aguilar Jd | $210,000 | Lsi Title Company | |
| Us Bank National Association | $269,320 | Accommodation | |
| Chaidez Juan M | -- | None Available | |
| Chaidez Juan M | $334,500 | First American Title |
Source: Public Records
Mortgage History
| Date | Status | Borrower | Loan Amount |
|---|---|---|---|
| Previous Owner | Chaidez Juan M | $267,000 | |
| Closed | Chaidez Juan M | $66,800 |
Source: Public Records
Tax History
| Year | Tax Paid | Tax Assessment Tax Assessment Total Assessment is a certain percentage of the fair market value that is determined by local assessors to be the total taxable value of land and additions on the property. | Land | Improvement |
|---|---|---|---|---|
| 2025 | $4,035 | $270,409 | $64,379 | $206,030 |
| 2024 | $4,035 | $265,108 | $63,117 | $201,991 |
| 2023 | $4,096 | $259,911 | $61,880 | $198,031 |
| 2022 | $4,194 | $254,816 | $60,667 | $194,149 |
| 2021 | $4,198 | $249,821 | $59,478 | $190,343 |
| 2020 | $3,629 | $247,261 | $58,869 | $188,392 |
| 2019 | $3,553 | $242,414 | $57,715 | $184,699 |
| 2018 | $3,506 | $237,662 | $56,584 | $181,078 |
| 2017 | $3,387 | $233,003 | $55,475 | $177,528 |
| 2016 | $3,250 | $228,436 | $54,388 | $174,048 |
| 2015 | $3,221 | $225,006 | $53,572 | $171,434 |
| 2014 | $3,192 | $220,599 | $52,523 | $168,076 |
Source: Public Records
Map
Nearby Homes
- 960 Elko St
- 330 Day St
- 1352 River Rd
- 1504 River Rd
- 29225 Chualar Canyon Rd
- 29155 Chualar Canyon Rd
- 29145 Chualar Canyon Rd
- 31102 Camphora Gloria Rd
- 844 River Rd
- 31021 Camphora Rd
- 604 Gardenia Place
- 449 Sage Ct
- 1231 Carmelo
- 463 Eckhardt Rd
- 1151 La Colina St
- 615 Monterey St
- 35095 Metz Rd
- 852 Mora Cir
- 836 Vasquez Dr
- 570 Tankersley St
- 1803 Chablis Way
- 1807 Chablis Way
- 1844 Burgundy Cir
- 1846 Burgundy Cir
- 1809 Chablis Way
- 1842 Burgundy Cir
- 1801 Chablis Way
- 1848 Burgundy Cir
- 1811 Chablis Way
- 1808 Chablis Way
- 1806 Chablis Way
- 1810 Chablis Way
- 1850 Burgundy Cir
- 1804 Chablis Way
- 1812 Chablis Way
- 1813 Chablis Way
- 1802 Chablis Way
- 1843 Burgundy Cir
- 1845 Burgundy Cir
- 1814 Chablis Way
Your Personal Tour Guide
Ask me questions while you tour the home.