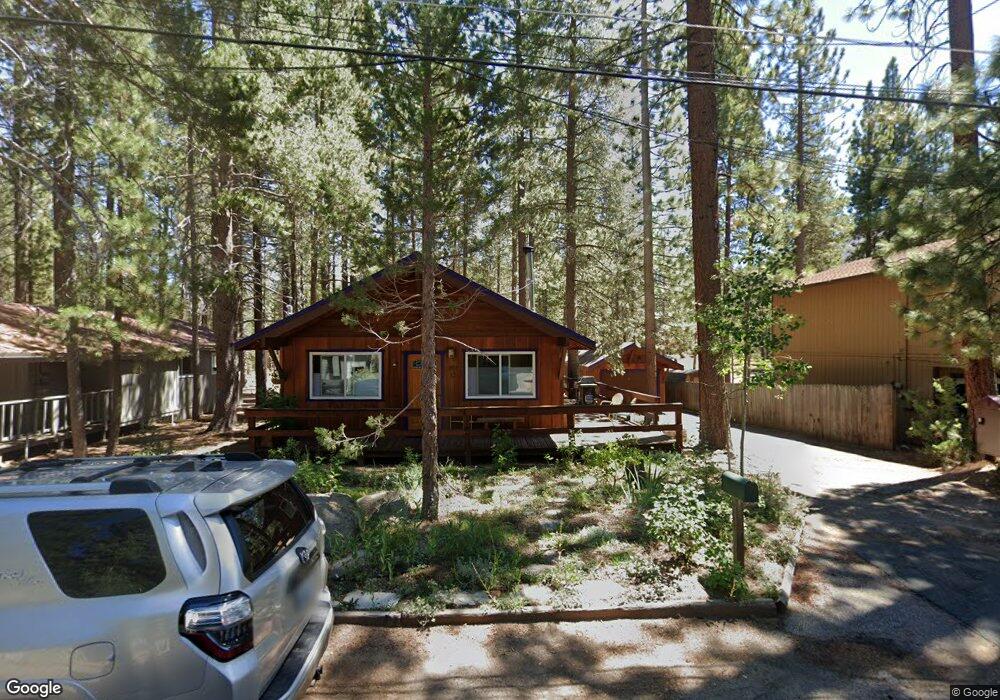
1805 Chibcha St South Lake Tahoe, CA 96150
Estimated Value: $439,000 - $578,000
2
Beds
1
Bath
960
Sq Ft
$541/Sq Ft
Est. Value
About This Home
This home is located at 1805 Chibcha St, South Lake Tahoe, CA 96150 and is currently estimated at $519,373, approximately $541 per square foot. 1805 Chibcha St is a home located in El Dorado County with nearby schools including Sierra House Elementary School, South Tahoe Middle School, and South Tahoe High School.
Ownership History
Date
Name
Owned For
Owner Type
Purchase Details
Closed on
Jul 22, 2010
Sold by
Finnigan Valerie
Bought by
Engelhardt Blake M and Engelhardt Christopher F
Current Estimated Value
Home Financials for this Owner
Home Financials are based on the most recent Mortgage that was taken out on this home.
Original Mortgage
$204,000
Outstanding Balance
$135,493
Interest Rate
4.71%
Mortgage Type
New Conventional
Estimated Equity
$383,880
Create a Home Valuation Report for This Property
The Home Valuation Report is an in-depth analysis detailing your home's value as well as a comparison with similar homes in the area
Home Values in the Area
Average Home Value in this Area
Purchase History
| Date | Buyer | Sale Price | Title Company |
|---|---|---|---|
| Engelhardt Blake M | $280,000 | Placer Title Company |
Source: Public Records
Mortgage History
| Date | Status | Borrower | Loan Amount |
|---|---|---|---|
| Open | Engelhardt Blake M | $204,000 |
Source: Public Records
Tax History Compared to Growth
Tax History
| Year | Tax Paid | Tax Assessment Tax Assessment Total Assessment is a certain percentage of the fair market value that is determined by local assessors to be the total taxable value of land and additions on the property. | Land | Improvement |
|---|---|---|---|---|
| 2025 | $3,844 | $358,710 | $147,326 | $211,384 |
| 2024 | $3,844 | $351,678 | $144,438 | $207,240 |
| 2023 | $3,777 | $344,783 | $141,606 | $203,177 |
| 2022 | $3,741 | $338,024 | $138,830 | $199,194 |
| 2021 | $3,680 | $331,397 | $136,108 | $195,289 |
| 2020 | $3,631 | $328,000 | $134,713 | $193,287 |
| 2019 | $3,613 | $321,570 | $132,072 | $189,498 |
| 2018 | $3,458 | $315,266 | $129,483 | $185,783 |
| 2017 | $3,403 | $309,086 | $126,945 | $182,141 |
| 2016 | $3,333 | $303,026 | $124,456 | $178,570 |
| 2015 | $3,163 | $298,477 | $122,588 | $175,889 |
| 2014 | $3,163 | $292,633 | $120,188 | $172,445 |
Source: Public Records
Map
Nearby Homes
- 1656 Oglala St
- 1617 Cree St
- 1589 Cree St
- 1678 Tionontati St
- 1713 Tionontati St
- 1670 Canienaga St
- 1579 Crystal Air Dr
- 1575 Crystal Air Dr
- 1671 Crystal Air Dr
- 1644 Crystal Air Dr
- 1513 Cree St
- 1567 Ojibwa St
- 1594 Canienaga St
- 1578 Skyline Dr
- 1952 Osage Cir
- 1540 Ojibwa St
- 1593 Plumas Cir
- 1442 Vanderhoof Rd
- 1431 Vanderhoof Rd
- 1428 Skyline Dr
- 1811 Chibcha St
- 1801 Chibcha St
- 1815 Chibcha St
- 1797 Chibcha St
- 1804 Chibcha St
- 1819 Chibcha St
- 1808 Chibcha St
- 1800 Chibcha St
- 1679 Oglala St
- 1794 Chibcha St
- 1787 Chibcha St
- 1784 Chibcha St
- 1829 Chibcha St
- 1783 Chibcha St
- 1826 Chibcha St
- 1797 Saponi St
- 1676 Oglala St
- 1793 Saponi St
- 1780 Chibcha St
- 1833 Chibcha St