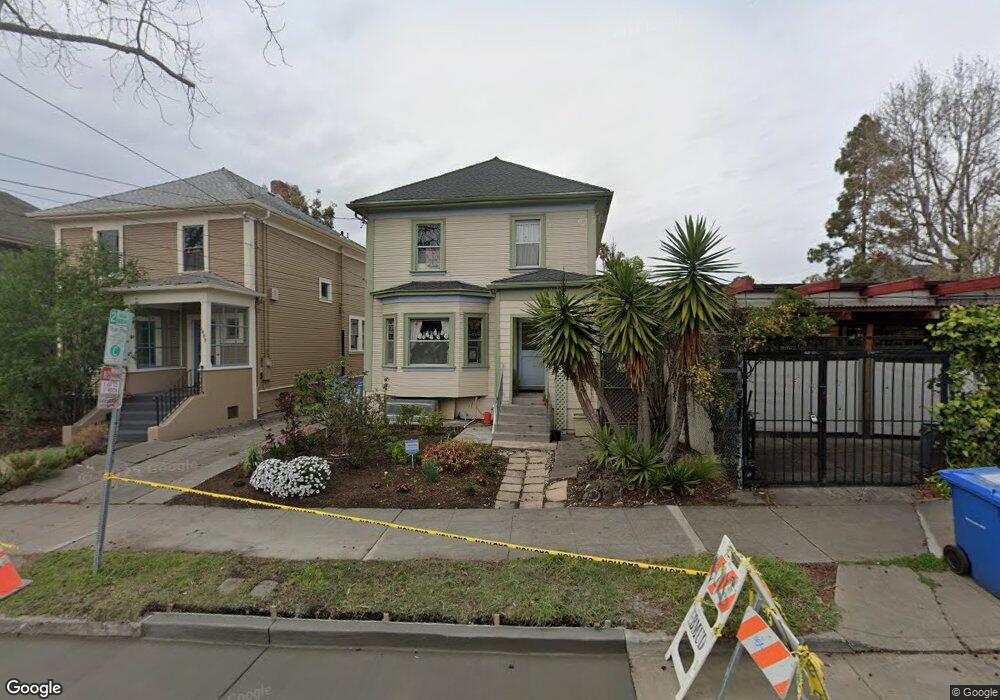
1805 Dwight Way Berkeley, CA 94703
Downtown Berkeley NeighborhoodEstimated Value: $1,146,000 - $1,442,000
3
Beds
3
Baths
2,132
Sq Ft
$599/Sq Ft
Est. Value
About This Home
This home is located at 1805 Dwight Way, Berkeley, CA 94703 and is currently estimated at $1,277,666, approximately $599 per square foot. 1805 Dwight Way is a home located in Alameda County with nearby schools including Washington Elementary School, Malcolm X Elementary School, and Berkeley Arts Magnet at Whittier School.
Ownership History
Date
Name
Owned For
Owner Type
Purchase Details
Closed on
Nov 5, 1997
Sold by
Morgan John L
Bought by
Shorer Gerald and Shorer Ruth
Current Estimated Value
Home Financials for this Owner
Home Financials are based on the most recent Mortgage that was taken out on this home.
Original Mortgage
$187,500
Outstanding Balance
$22,258
Interest Rate
4%
Estimated Equity
$1,255,408
Purchase Details
Closed on
Jul 31, 1995
Sold by
Morgan John L
Bought by
Morgan John L
Home Financials for this Owner
Home Financials are based on the most recent Mortgage that was taken out on this home.
Original Mortgage
$210,000
Interest Rate
7.71%
Purchase Details
Closed on
May 3, 1994
Sold by
Morgan John L and Morgan Estelle M
Bought by
Morgan John L and Morgan Estelle M
Create a Home Valuation Report for This Property
The Home Valuation Report is an in-depth analysis detailing your home's value as well as a comparison with similar homes in the area
Home Values in the Area
Average Home Value in this Area
Purchase History
| Date | Buyer | Sale Price | Title Company |
|---|---|---|---|
| Shorer Gerald | $250,000 | Nortwestern Title Company | |
| Morgan John L | -- | Fidelity National Title Co | |
| Morgan John L | -- | Fidelity National Title Co | |
| Morgan John L | -- | -- |
Source: Public Records
Mortgage History
| Date | Status | Borrower | Loan Amount |
|---|---|---|---|
| Open | Shorer Gerald | $187,500 | |
| Previous Owner | Morgan John L | $210,000 |
Source: Public Records
Tax History
| Year | Tax Paid | Tax Assessment Tax Assessment Total Assessment is a certain percentage of the fair market value that is determined by local assessors to be the total taxable value of land and additions on the property. | Land | Improvement |
|---|---|---|---|---|
| 2025 | $8,892 | $392,167 | $119,750 | $279,417 |
| 2024 | $8,892 | $384,341 | $117,402 | $273,939 |
| 2023 | $8,676 | $383,670 | $115,101 | $268,569 |
| 2022 | $8,451 | $369,147 | $112,844 | $263,303 |
| 2021 | $8,422 | $361,771 | $110,631 | $258,140 |
| 2020 | $7,803 | $364,991 | $109,497 | $255,494 |
| 2019 | $7,312 | $357,837 | $107,351 | $250,486 |
| 2018 | $7,149 | $350,821 | $105,246 | $245,575 |
| 2017 | $6,869 | $343,944 | $103,183 | $240,761 |
| 2016 | $6,526 | $337,201 | $101,160 | $236,041 |
| 2015 | $6,422 | $332,137 | $99,641 | $232,496 |
| 2014 | $6,507 | $325,631 | $97,689 | $227,942 |
Source: Public Records
Map
Nearby Homes
- 1901 Parker St Unit 3
- 1819 Carleton St
- 1634 Blake St
- 1604 Dwight Way
- 2701 Grant St
- 1612 Parker St
- 1524 Blake St
- 2218 -2222 Grant St
- 1515 Derby St
- 2350 Sacramento St
- 2437 Acton St
- 2118 California St
- 2304 Edwards St
- 2750 Sacramento St
- 1450 Ward St
- 2829 California St
- 2758 Sacramento St
- 2774 Sacramento St
- 2782 Sacramento St
- 2790 Sacramento St
- 1803 Dwight Way
- 1801 Dwight Way
- 2439 Grant St
- 2434 Mckinley Ave
- 2432 Mckinley Ave
- 1816 Dwight Way Unit 12
- 1806 Dwight Way Unit 12
- 1816 Dwight Way Unit 7
- 1806 Dwight Way
- 1804 Dwight Way Unit 1
- 1812 Dwight Way
- 1808 Dwight Way Unit 12
- 1810 Dwight Way Unit 12
- 1818 Dwight Way Unit 12
- 1814 Dwight Way Unit 12
- 1818 Dwight Way
- 1814 Dwight Way Unit 6
- 1812 Dwight Way Unit 5
- 1810 Dwight Way
- 1808 Dwight Way
Your Personal Tour Guide
Ask me questions while you tour the home.