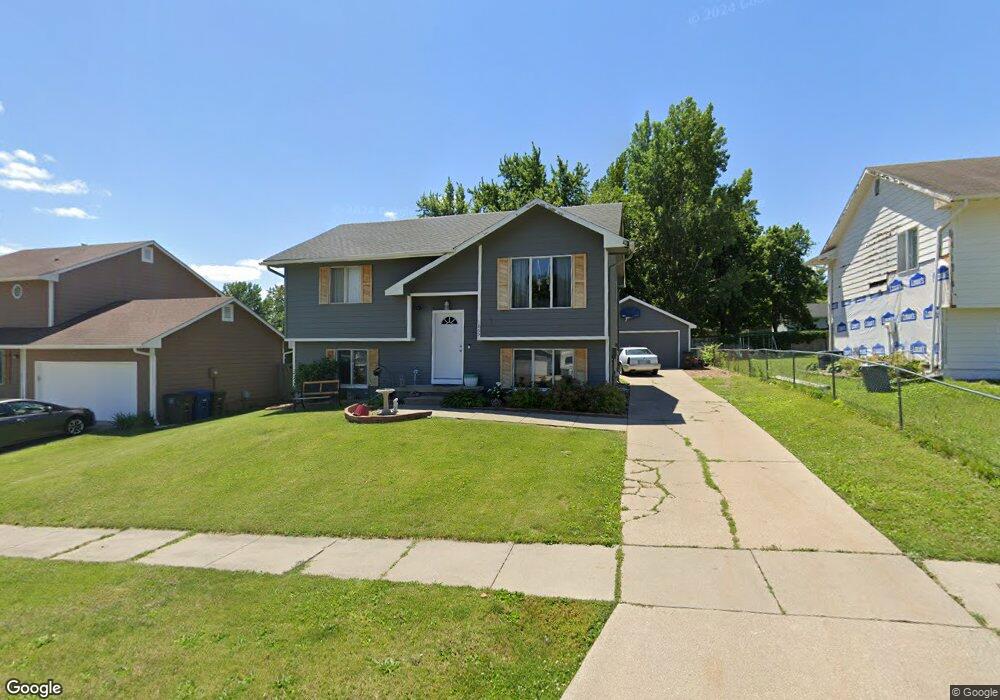
1805 E Lacona Ave Des Moines, IA 50320
Pioneer Park NeighborhoodEstimated Value: $227,000 - $242,000
3
Beds
2
Baths
857
Sq Ft
$275/Sq Ft
Est. Value
About This Home
This home is located at 1805 E Lacona Ave, Des Moines, IA 50320 and is currently estimated at $235,543, approximately $274 per square foot. 1805 E Lacona Ave is a home located in Polk County with nearby schools including River Woods Elementary School, Weeks Middle School, and St. Anthony Elementary School.
Ownership History
Date
Name
Owned For
Owner Type
Purchase Details
Closed on
Nov 20, 2009
Sold by
Long Steven J
Bought by
Fenimore Jennifer
Current Estimated Value
Home Financials for this Owner
Home Financials are based on the most recent Mortgage that was taken out on this home.
Original Mortgage
$132,358
Outstanding Balance
$80,744
Interest Rate
3.75%
Mortgage Type
FHA
Estimated Equity
$154,799
Purchase Details
Closed on
Aug 1, 2009
Sold by
Bradish Cynthia L
Bought by
Long Steven J
Home Financials for this Owner
Home Financials are based on the most recent Mortgage that was taken out on this home.
Original Mortgage
$74,000
Interest Rate
6%
Mortgage Type
Future Advance Clause Open End Mortgage
Purchase Details
Closed on
Jun 11, 1999
Sold by
Tezlaff Wayne J and Tezlaff Barbara A
Bought by
Bradish Cynthia L
Home Financials for this Owner
Home Financials are based on the most recent Mortgage that was taken out on this home.
Original Mortgage
$97,853
Interest Rate
7.54%
Mortgage Type
FHA
Create a Home Valuation Report for This Property
The Home Valuation Report is an in-depth analysis detailing your home's value as well as a comparison with similar homes in the area
Home Values in the Area
Average Home Value in this Area
Purchase History
| Date | Buyer | Sale Price | Title Company |
|---|---|---|---|
| Fenimore Jennifer | $134,500 | Itc | |
| Long Steven J | $82,000 | Itc | |
| Bradish Cynthia L | $97,500 | -- |
Source: Public Records
Mortgage History
| Date | Status | Borrower | Loan Amount |
|---|---|---|---|
| Open | Fenimore Jennifer | $132,358 | |
| Previous Owner | Long Steven J | $74,000 | |
| Previous Owner | Bradish Cynthia L | $97,853 |
Source: Public Records
Tax History Compared to Growth
Tax History
| Year | Tax Paid | Tax Assessment Tax Assessment Total Assessment is a certain percentage of the fair market value that is determined by local assessors to be the total taxable value of land and additions on the property. | Land | Improvement |
|---|---|---|---|---|
| 2025 | $3,860 | $229,700 | $42,900 | $186,800 |
| 2024 | $3,860 | $206,700 | $38,100 | $168,600 |
| 2023 | $3,812 | $206,700 | $38,100 | $168,600 |
| 2022 | $3,780 | $170,600 | $32,400 | $138,200 |
| 2021 | $3,600 | $170,600 | $32,400 | $138,200 |
| 2020 | $3,736 | $152,900 | $29,000 | $123,900 |
| 2019 | $3,166 | $152,900 | $29,000 | $123,900 |
| 2018 | $3,128 | $126,300 | $23,700 | $102,600 |
| 2017 | $2,904 | $126,300 | $23,700 | $102,600 |
| 2016 | $2,824 | $115,900 | $21,300 | $94,600 |
| 2015 | $2,824 | $115,900 | $21,300 | $94,600 |
| 2014 | $2,580 | $109,700 | $20,100 | $89,600 |
Source: Public Records
Map
Nearby Homes
- 2518 SE 18th St
- 2618 SE 18th Ct
- 1943 E Bell Ave
- 2735 SE 17th St
- 1847 Virginia Cir
- 1635 E Virginia Ave
- 1834 E Park Ave
- 1534 King Ave
- 3214 SE 20th St
- 1607 Pioneer Rd
- 3307 SE 19th St
- 1440 E Glenwood Dr
- 3101 SE 22nd St
- 3406 SE 19th Ct
- 3244 SE 20th St
- 2909 Shadow Creek Ln
- 3507 SE 18th Ct
- 1437 E Pleasant View Dr
- 2825 SE 14th St Unit 57
- 2825 SE 14th St Unit 36
- 1803 E Lacona Ave
- 1807 E Lacona Ave
- 2512 SE 18th Ct
- 2513 SE 18th St
- 1801 E Lacona Ave
- 2516 SE 18th Ct
- 1806 E Lacona Ave
- 2517 SE 18th St
- 2521 SE 18th St
- 2520 SE 18th Ct
- 2446 SE 18th Ct
- 2447 SE 18th St
- 2511 SE 18th Ct
- 2605 SE 18th St
- 1817 E Lacona Ave
- 2608 SE 18th Ct
- 2515 SE 18th Ct
- 2442 SE 18th Ct
- 2451 SE 18th Ct
- 2443 SE 18th St