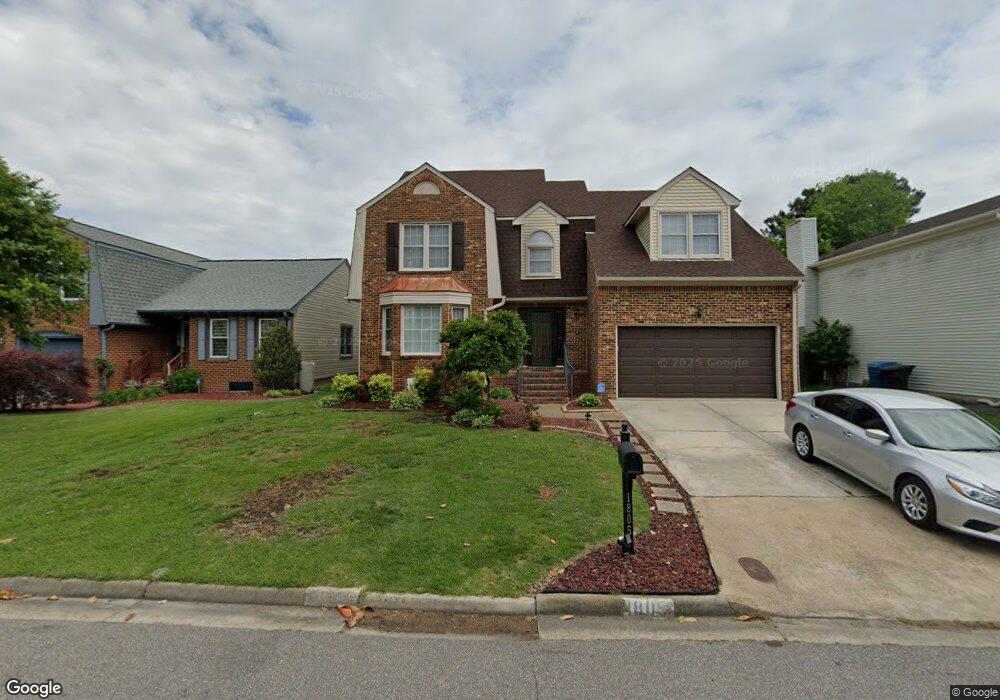
1805 Grey Friars Chase Virginia Beach, VA 23456
Salem NeighborhoodEstimated Value: $513,136 - $570,000
4
Beds
3
Baths
2,370
Sq Ft
$227/Sq Ft
Est. Value
About This Home
This home is located at 1805 Grey Friars Chase, Virginia Beach, VA 23456 and is currently estimated at $539,034, approximately $227 per square foot. 1805 Grey Friars Chase is a home located in Virginia Beach City with nearby schools including Rosemont Forest Elementary School, Salem Middle School, and Salem High School.
Ownership History
Date
Name
Owned For
Owner Type
Purchase Details
Closed on
Nov 30, 2020
Sold by
Gray Jeffrey R and Gray Janice A
Bought by
Norman Gamaliel A and Norman Joshlyn N
Current Estimated Value
Home Financials for this Owner
Home Financials are based on the most recent Mortgage that was taken out on this home.
Original Mortgage
$384,750
Outstanding Balance
$343,153
Interest Rate
2.8%
Mortgage Type
New Conventional
Estimated Equity
$195,881
Purchase Details
Closed on
Jul 10, 2002
Sold by
Truong Thang
Bought by
Kinariwala Smruti Jayesh
Purchase Details
Closed on
Oct 14, 1999
Sold by
Chintawongvanich Somsak
Bought by
Truong Thang
Home Financials for this Owner
Home Financials are based on the most recent Mortgage that was taken out on this home.
Original Mortgage
$124,000
Interest Rate
7.78%
Create a Home Valuation Report for This Property
The Home Valuation Report is an in-depth analysis detailing your home's value as well as a comparison with similar homes in the area
Home Values in the Area
Average Home Value in this Area
Purchase History
| Date | Buyer | Sale Price | Title Company |
|---|---|---|---|
| Norman Gamaliel A | $405,000 | Wfg National Title Ins Co | |
| Kinariwala Smruti Jayesh | $190,501 | -- | |
| Truong Thang | $155,000 | -- |
Source: Public Records
Mortgage History
| Date | Status | Borrower | Loan Amount |
|---|---|---|---|
| Open | Norman Gamaliel A | $384,750 | |
| Previous Owner | Truong Thang | $124,000 |
Source: Public Records
Tax History Compared to Growth
Tax History
| Year | Tax Paid | Tax Assessment Tax Assessment Total Assessment is a certain percentage of the fair market value that is determined by local assessors to be the total taxable value of land and additions on the property. | Land | Improvement |
|---|---|---|---|---|
| 2025 | $4,477 | $471,200 | $170,000 | $301,200 |
| 2024 | $4,477 | $461,500 | $170,000 | $291,500 |
| 2023 | $4,201 | $424,300 | $135,000 | $289,300 |
| 2022 | $3,746 | $378,400 | $115,000 | $263,400 |
| 2021 | $3,631 | $366,800 | $115,000 | $251,800 |
| 2020 | $3,212 | $315,700 | $115,000 | $200,700 |
| 2019 | $3,171 | $306,100 | $115,000 | $191,100 |
| 2018 | $3,069 | $306,100 | $115,000 | $191,100 |
| 2017 | $3,068 | $306,000 | $110,000 | $196,000 |
| 2016 | $3,029 | $306,000 | $110,000 | $196,000 |
| 2015 | $3,085 | $311,600 | $110,000 | $201,600 |
| 2014 | $2,594 | $311,300 | $117,000 | $194,300 |
Source: Public Records
Map
Nearby Homes
- 1900 Grey Friars Chase
- 1652 Castlefield Rd
- 1900 Haywards Heath
- 1637 Castlefield Rd
- 4305 Salem Springs Way
- 4357 Elderberry Ln
- 1912 Bunnell Ct
- 4521 Van Dyck Dr
- 1412 Athol Ct
- 1573 Wynd Crest Way
- 5224 Thatcher Way
- 1425 Round Hill Dr
- 1044 Villas Ct
- 5233 Thatcher Way
- 5245 Thatcher Way
- 4224 Turnworth Arch
- 4276 Derby Wharf Dr
- 1156 Eagle Way
- 4225 Kenton Ln
- 1613 Cliffwood Dr
- 1801 Grey Friars Chase
- 1809 Grey Friars Chase
- 1827 Grey Friars Chase
- 1701 Handcross Way
- 1705 Handcross Way
- 1797 Grey Friars Chase
- 1800 Grey Friars Chase
- 1804 Grey Friars Chase
- 1709 Handcross Way
- 1798 Grey Friars Chase
- 1793 Grey Friars Chase
- 1808 Grey Friars Chase
- 1824 Grey Friars Chase
- 1828 Grey Friars Chase
- 1820 Grey Friars Chase
- 1796 Grey Friars Chase
- 1832 Grey Friars Chase
- 1816 Grey Friars Chase
- 1789 Grey Friars Chase
- 1662 Castlefield Rd