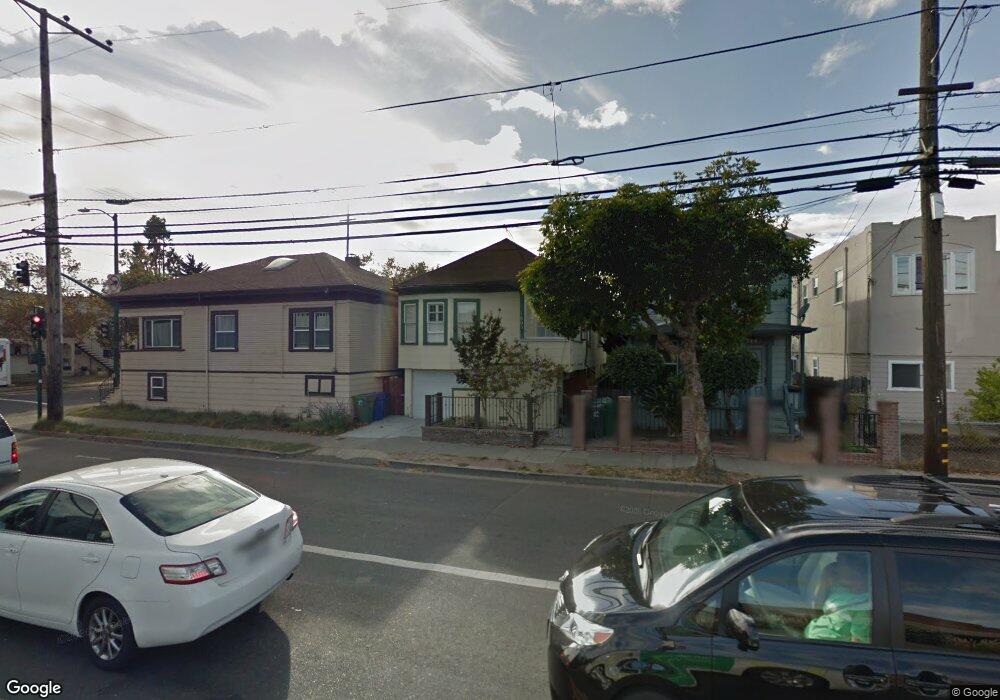
1805 Sherman St Alameda, CA 94501
West Alameda NeighborhoodEstimated Value: $817,000 - $1,094,087
3
Beds
1
Bath
1,196
Sq Ft
$810/Sq Ft
Est. Value
About This Home
This home is located at 1805 Sherman St, Alameda, CA 94501 and is currently estimated at $968,772, approximately $810 per square foot. 1805 Sherman St is a home located in Alameda County with nearby schools including Maya Lin School, Will C. Wood Middle School, and Encinal Junior/Senior High.
Ownership History
Date
Name
Owned For
Owner Type
Purchase Details
Closed on
Oct 29, 2013
Sold by
Jimenez Alicia
Bought by
Jimenez Jaime and Jimenez Alicia
Current Estimated Value
Purchase Details
Closed on
Jul 9, 2009
Sold by
Wachovia Mortgage Bank Fsb
Bought by
Jimenez Alicia and Jimenez Osvaldo
Purchase Details
Closed on
Mar 3, 1998
Sold by
Pascua Daryl A and Aganon Eric J
Bought by
Pascua Daryl A
Home Financials for this Owner
Home Financials are based on the most recent Mortgage that was taken out on this home.
Original Mortgage
$201,500
Interest Rate
6.9%
Purchase Details
Closed on
Dec 15, 1997
Sold by
Chu Kam W
Bought by
Pascua Daryl A and Aganon Eric J
Home Financials for this Owner
Home Financials are based on the most recent Mortgage that was taken out on this home.
Original Mortgage
$158,395
Interest Rate
7.9%
Create a Home Valuation Report for This Property
The Home Valuation Report is an in-depth analysis detailing your home's value as well as a comparison with similar homes in the area
Home Values in the Area
Average Home Value in this Area
Purchase History
| Date | Buyer | Sale Price | Title Company |
|---|---|---|---|
| Jimenez Jaime | -- | None Available | |
| Jimenez Alicia | $188,227 | Fidelity National Title Co | |
| Pascua Daryl A | $20,500 | Fidelity National Title Ins | |
| Pascua Daryl A | $176,000 | Commonwealth Land Title Co |
Source: Public Records
Mortgage History
| Date | Status | Borrower | Loan Amount |
|---|---|---|---|
| Previous Owner | Pascua Daryl A | $201,500 | |
| Previous Owner | Pascua Daryl A | $158,395 |
Source: Public Records
Tax History Compared to Growth
Tax History
| Year | Tax Paid | Tax Assessment Tax Assessment Total Assessment is a certain percentage of the fair market value that is determined by local assessors to be the total taxable value of land and additions on the property. | Land | Improvement |
|---|---|---|---|---|
| 2025 | $5,933 | $316,874 | $158,437 | $158,437 |
| 2024 | $5,933 | $310,662 | $155,331 | $155,331 |
| 2023 | $5,742 | $304,572 | $152,286 | $152,286 |
| 2022 | $5,629 | $298,600 | $149,300 | $149,300 |
| 2021 | $5,512 | $292,748 | $146,374 | $146,374 |
| 2020 | $5,451 | $289,748 | $144,874 | $144,874 |
| 2019 | $4,927 | $284,068 | $142,034 | $142,034 |
| 2018 | $4,816 | $278,500 | $139,250 | $139,250 |
| 2017 | $4,630 | $273,040 | $136,520 | $136,520 |
| 2016 | $4,539 | $267,688 | $133,844 | $133,844 |
| 2015 | $4,519 | $263,668 | $131,834 | $131,834 |
| 2014 | $4,347 | $258,506 | $129,253 | $129,253 |
Source: Public Records
Map
Nearby Homes
- 1209 Lincoln Ave
- 1711 Arbor St
- 1815 Balsa St
- 1613 Stanton St
- 1059 Santa Clara Ave
- 1523 Verdi St
- 1512 Mozart St
- 1560 Lincoln Ave
- 1572 Lincoln Ave
- 830 Buena Vista Ave
- 23 Redondo Ct Unit 142
- 1203 Benton St
- 1834 8th St
- 1319 Paru St
- 937 Independence Dr
- 1303 Paru St
- 1661 Ave
- 1665 Ellen Craig Ave
- 1662 Larkspur St
- 1669 Ellen Craig Ave
- 1807 Sherman St
- 1221 Buena Vista Ave
- 1811 Sherman St
- 1217 Buena Vista Ave
- 1813 Sherman St
- 1209 Buena Vista Ave
- 1815 Sherman St
- 1721 Sherman St
- 1817 Sherman St
- 1205 Buena Vista Ave
- 1214 Buena Vista Ave
- 1212 Buena Vista Ave
- 1819 Sherman St
- 1216 Eagle Ave
- 1816 Bay St
- 1203 Buena Vista Ave
- 1719 Sherman St
- 1206 Buena Vista Ave
- 1818 Bay St
- 1821 Sherman St