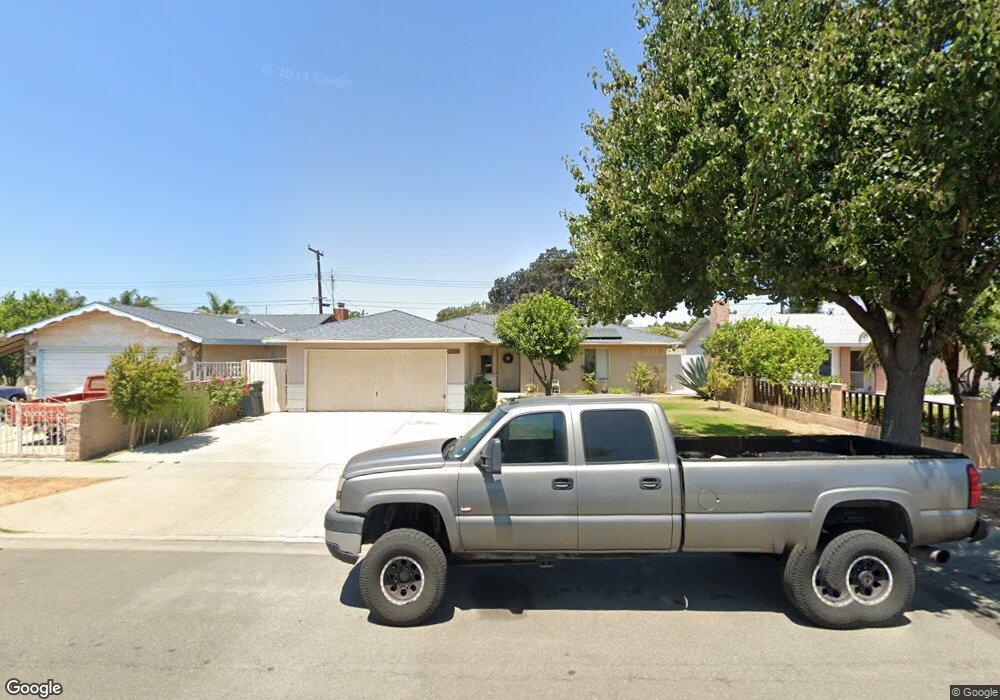
1805 W Carlton Place Santa Ana, CA 92704
Valley Adams NeighborhoodEstimated Value: $850,000 - $1,016,000
3
Beds
2
Baths
1,223
Sq Ft
$757/Sq Ft
Est. Value
About This Home
This home is located at 1805 W Carlton Place, Santa Ana, CA 92704 and is currently estimated at $926,397, approximately $757 per square foot. 1805 W Carlton Place is a home located in Orange County with nearby schools including Gerald P. Carr Intermediate School, Valley High School, and Mater Dei High School.
Ownership History
Date
Name
Owned For
Owner Type
Purchase Details
Closed on
Aug 18, 2023
Sold by
Silva Raul M
Bought by
Raul M Silva Living Trust and Silva
Current Estimated Value
Purchase Details
Closed on
Sep 25, 2001
Sold by
Delatorre Hector and Delatorre Eren
Bought by
Silva Raul M
Home Financials for this Owner
Home Financials are based on the most recent Mortgage that was taken out on this home.
Original Mortgage
$154,049
Interest Rate
6.87%
Purchase Details
Closed on
Jun 3, 1998
Sold by
Firststar Trust Company
Bought by
Silva Raul and Delatorre Hector
Home Financials for this Owner
Home Financials are based on the most recent Mortgage that was taken out on this home.
Original Mortgage
$152,296
Interest Rate
7.17%
Mortgage Type
FHA
Purchase Details
Closed on
Jul 8, 1997
Sold by
Medina Thomas D and Medina Beverly G
Bought by
Firstar Trust Company and First Wisconsin Trust Company
Purchase Details
Closed on
Apr 22, 1997
Sold by
Medina Thomas D
Bought by
Wood Holly and Aruba Group
Create a Home Valuation Report for This Property
The Home Valuation Report is an in-depth analysis detailing your home's value as well as a comparison with similar homes in the area
Home Values in the Area
Average Home Value in this Area
Purchase History
| Date | Buyer | Sale Price | Title Company |
|---|---|---|---|
| Raul M Silva Living Trust | -- | None Listed On Document | |
| Silva Raul M | -- | Old Republic Title Company | |
| Silva Raul | $155,000 | Chicago Title Co | |
| Firstar Trust Company | $127,623 | Benefit Land Title Ins Compa | |
| Wood Holly | -- | -- |
Source: Public Records
Mortgage History
| Date | Status | Borrower | Loan Amount |
|---|---|---|---|
| Previous Owner | Silva Raul M | $154,049 | |
| Previous Owner | Silva Raul | $152,296 |
Source: Public Records
Tax History Compared to Growth
Tax History
| Year | Tax Paid | Tax Assessment Tax Assessment Total Assessment is a certain percentage of the fair market value that is determined by local assessors to be the total taxable value of land and additions on the property. | Land | Improvement |
|---|---|---|---|---|
| 2025 | $3,743 | $314,478 | $226,903 | $87,575 |
| 2024 | $3,743 | $308,312 | $222,454 | $85,858 |
| 2023 | $3,648 | $302,267 | $218,092 | $84,175 |
| 2022 | $3,606 | $296,341 | $213,816 | $82,525 |
| 2021 | $3,522 | $290,531 | $209,624 | $80,907 |
| 2020 | $3,527 | $287,552 | $207,474 | $80,078 |
| 2019 | $3,458 | $281,914 | $203,406 | $78,508 |
| 2018 | $3,328 | $276,387 | $199,418 | $76,969 |
| 2017 | $3,298 | $270,968 | $195,508 | $75,460 |
| 2016 | $3,232 | $265,655 | $191,674 | $73,981 |
| 2015 | $3,190 | $261,665 | $188,795 | $72,870 |
| 2014 | $3,133 | $256,540 | $185,097 | $71,443 |
Source: Public Records
Map
Nearby Homes
- 1838 S Artesia St
- 2030 S Spruce St
- 1501 S Raitt St Unit 115
- 2108 S Artesia St
- 1402 S Poplar St
- 1411 W Elder Ave
- 2309 W Anahurst Place
- 1912 W Wilshire Ave
- 2029 W Flora St
- 2513 W Occidental St
- 2500 S Salta St Unit 43
- 2521 W Stanford St
- 1246 S Baker St
- 1709 S Towner St
- 1114 S Pacific Ave
- 2618 S Pacific Ave
- 1039 W Central Ave
- 2322 S Greenville St
- 1317 W Mcfadden Ave
- 1023 W Central Ave
- 1813 W Carlton Place
- 1801 W Carlton Place
- 1806 W Saint Andrew Place
- 1802 W Saint Andrew Place
- 1817 W Carlton Place
- 1729 W Carlton Place
- 1810 W Saint Andrew Place
- 1730 W Saint Andrew Place
- 1802 W Carlton Place
- 1806 W Carlton Place
- 1814 W Saint Andrew Place
- 1730 W Carlton Place
- 1814 W Carlton Place
- 1821 W Carlton Place
- 1725 W Carlton Place
- 1726 W Saint Andrew Place
- 1726 W Carlton Place
- 1818 W Carlton Place
- 1822 W Saint Andrew Place
- 1721 W Carlton Place