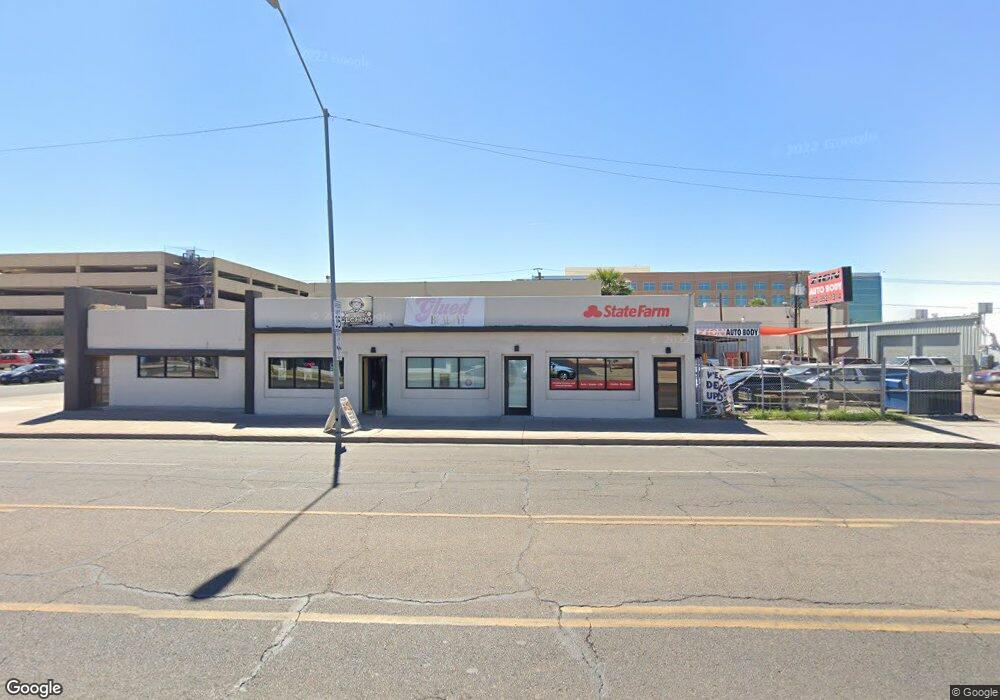
1805 W Van Buren St Unit 1807 Phoenix, AZ 85007
Governmental Mall NeighborhoodEstimated Value: $1,413,524
--
Bed
--
Bath
9,584
Sq Ft
$147/Sq Ft
Est. Value
About This Home
This home is located at 1805 W Van Buren St Unit 1807, Phoenix, AZ 85007 and is currently estimated at $1,413,524, approximately $147 per square foot. 1805 W Van Buren St Unit 1807 is a home located in Maricopa County with nearby schools including Mary Mcleod Bethune School, Phoenix Coding Academy, and Central High School.
Ownership History
Date
Name
Owned For
Owner Type
Purchase Details
Closed on
Feb 4, 2025
Sold by
1800 Crown Llc
Bought by
Fen Investments Inc
Current Estimated Value
Home Financials for this Owner
Home Financials are based on the most recent Mortgage that was taken out on this home.
Original Mortgage
$615,000
Outstanding Balance
$562,514
Interest Rate
6.85%
Mortgage Type
New Conventional
Estimated Equity
$851,010
Purchase Details
Closed on
Jan 22, 2019
Sold by
Smith Terrel L and Smith Terrel L
Bought by
1800 Crown Llc
Home Financials for this Owner
Home Financials are based on the most recent Mortgage that was taken out on this home.
Original Mortgage
$560,000
Interest Rate
4.5%
Mortgage Type
Seller Take Back
Create a Home Valuation Report for This Property
The Home Valuation Report is an in-depth analysis detailing your home's value as well as a comparison with similar homes in the area
Home Values in the Area
Average Home Value in this Area
Purchase History
| Date | Buyer | Sale Price | Title Company |
|---|---|---|---|
| Fen Investments Inc | $1,390,000 | Clear Title Agency Of Arizona | |
| 1800 Crown Llc | $805,000 | Chicago Title Agency Inc |
Source: Public Records
Mortgage History
| Date | Status | Borrower | Loan Amount |
|---|---|---|---|
| Open | Fen Investments Inc | $615,000 | |
| Previous Owner | 1800 Crown Llc | $560,000 |
Source: Public Records
Tax History Compared to Growth
Tax History
| Year | Tax Paid | Tax Assessment Tax Assessment Total Assessment is a certain percentage of the fair market value that is determined by local assessors to be the total taxable value of land and additions on the property. | Land | Improvement |
|---|---|---|---|---|
| 2025 | $8,914 | $64,638 | -- | -- |
| 2024 | $9,095 | $63,483 | -- | -- |
| 2023 | $9,095 | $145,214 | $26,180 | $119,034 |
| 2022 | $9,030 | $131,565 | $19,285 | $112,280 |
| 2021 | $9,218 | $82,944 | $19,836 | $63,108 |
| 2020 | $9,325 | $80,406 | $18,234 | $62,172 |
| 2019 | $9,309 | $75,312 | $14,688 | $60,624 |
| 2018 | $9,150 | $72,144 | $12,780 | $59,364 |
| 2017 | $8,938 | $63,990 | $13,302 | $50,688 |
| 2016 | $8,681 | $58,104 | $12,096 | $46,008 |
| 2015 | $8,256 | $47,120 | $12,081 | $35,039 |
Source: Public Records
Map
Nearby Homes
- 325 N 17th Dr
- 329 N 17th Dr
- 1945 W Van Buren St
- 1913 W Adams St
- 415 N 17th Dr
- 2002 W Adams St
- 1941 W Washington St Unit 9
- 2002 W Jefferson St
- 2013 W Jefferson St
- 2006 W Madison St
- 1522 W Fillmore St
- 1522 W Fillmore St Unit 6-7
- 1322 W Monroe St
- 1315 W Woodland Ave
- 2201 W Washington St
- 1830 W Fillmore St Unit 3
- 1322 W Taylor St
- 2215 W Washington St
- 1330 W Fillmore St
- 1711 W Latham St
- 1805 W Van Buren St
- 1805 W Van Buren St Unit 1805
- 1805 W Van Buren St Unit 200
- 214 N 18th Ave Unit 200
- 1817 W Van Buren St
- 310 N 18th Ave Unit 1
- 310 N 18th Ave Unit 2
- 1800 W Van Buren St
- 311 N 18th Ave
- 313 N 18th Ave Unit R
- 313 N 18th Ave
- 318 N 18th Ave
- 315 N 18th Ave
- 315 N 18th Ave Unit R
- 317 N 18th Ave
- 324 N 18th Ave
- 321 N 18th Dr
- 317 N 19th Ave
- 314 N 17th Dr
- 314 N 17th Dr Unit R