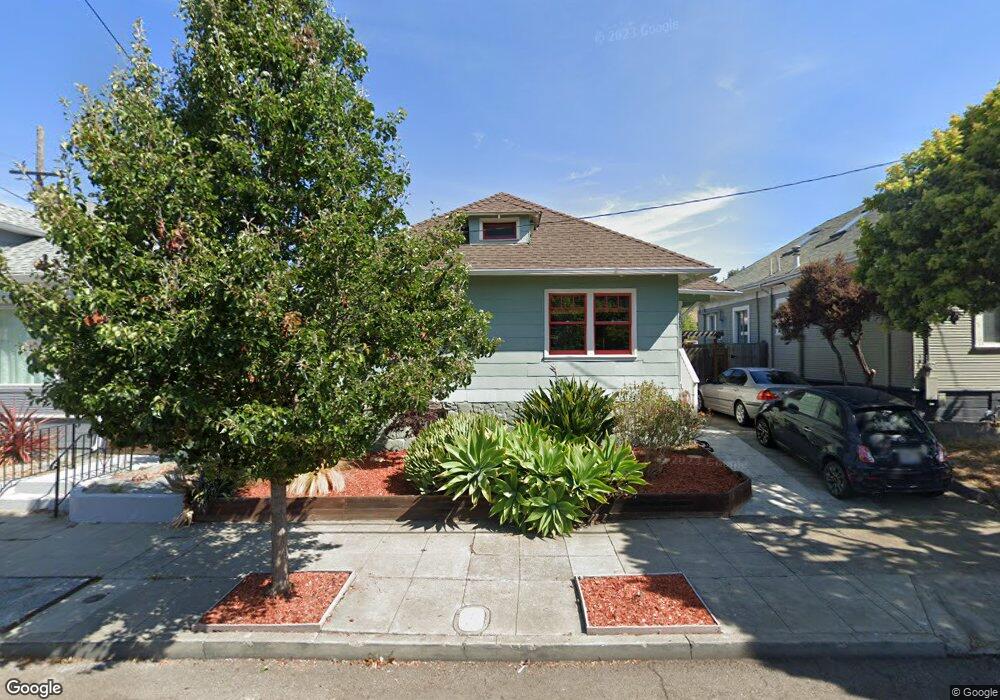
1805 Ward St Berkeley, CA 94703
South Berkeley NeighborhoodEstimated Value: $1,015,000 - $1,483,000
2
Beds
1
Bath
960
Sq Ft
$1,185/Sq Ft
Est. Value
About This Home
This home is located at 1805 Ward St, Berkeley, CA 94703 and is currently estimated at $1,137,828, approximately $1,185 per square foot. 1805 Ward St is a home located in Alameda County with nearby schools including Malcolm X Elementary School, Emerson Elementary School, and John Muir Elementary School.
Ownership History
Date
Name
Owned For
Owner Type
Purchase Details
Closed on
Jan 8, 2020
Sold by
Handleman Scott D and Cutchin Carl Rae
Bought by
Handleman Scott D and Cutchin Carl Rae
Current Estimated Value
Purchase Details
Closed on
Mar 28, 2013
Sold by
Stucky Matthew and Goldberg Melanie C
Bought by
Cutchin Carli and Handleman Scott
Purchase Details
Closed on
Jan 6, 2009
Sold by
Goldberg Melanie C
Bought by
Stucky Matt
Home Financials for this Owner
Home Financials are based on the most recent Mortgage that was taken out on this home.
Original Mortgage
$320,000
Interest Rate
5.97%
Mortgage Type
Purchase Money Mortgage
Create a Home Valuation Report for This Property
The Home Valuation Report is an in-depth analysis detailing your home's value as well as a comparison with similar homes in the area
Home Values in the Area
Average Home Value in this Area
Purchase History
| Date | Buyer | Sale Price | Title Company |
|---|---|---|---|
| Handleman Scott D | -- | None Available | |
| Handleman Scott D | -- | None Available | |
| Cutchin Carli | $682,000 | Chicago Title Company | |
| Stucky Matt | -- | Old Republic Title Company | |
| Stucky Matt | $400,000 | Old Republic Title Company | |
| Stucky Matthew | -- | Old Republic Title Company |
Source: Public Records
Mortgage History
| Date | Status | Borrower | Loan Amount |
|---|---|---|---|
| Previous Owner | Stucky Matt | $320,000 |
Source: Public Records
Tax History
| Year | Tax Paid | Tax Assessment Tax Assessment Total Assessment is a certain percentage of the fair market value that is determined by local assessors to be the total taxable value of land and additions on the property. | Land | Improvement |
|---|---|---|---|---|
| 2025 | $11,917 | $839,800 | $251,940 | $587,860 |
| 2024 | $11,917 | $823,337 | $247,001 | $576,336 |
| 2023 | $11,680 | $807,194 | $242,158 | $565,036 |
| 2022 | $11,496 | $791,371 | $237,411 | $553,960 |
| 2021 | $11,539 | $775,856 | $232,757 | $543,099 |
| 2020 | $10,991 | $767,904 | $230,371 | $537,533 |
| 2019 | $10,635 | $752,852 | $225,855 | $526,997 |
| 2018 | $10,473 | $738,094 | $221,428 | $516,666 |
| 2017 | $10,110 | $723,621 | $217,086 | $506,535 |
| 2016 | $9,836 | $709,436 | $212,831 | $496,605 |
| 2015 | $9,714 | $698,783 | $209,635 | $489,148 |
| 2014 | $9,667 | $685,095 | $205,528 | $479,567 |
Source: Public Records
Map
Nearby Homes
- 2701 Grant St
- 1901 Parker St Unit 3
- 1612 Carleton St
- 1612 Parker St
- 2926 Ellis St
- 2018 Blake St
- 1530 Stuart St
- 1645 Dwight Way
- 1515 Derby St
- 1646 Ashby Ave
- 1535 Julia St
- 2750 Sacramento St
- 2758 Sacramento St
- 2774 Sacramento St
- 1450 Ward St
- 2782 Sacramento St
- 2057 Emerson St
- 2790 Sacramento St
- 2110 Ashby Ave
- 2923 Wheeler St
Your Personal Tour Guide
Ask me questions while you tour the home.