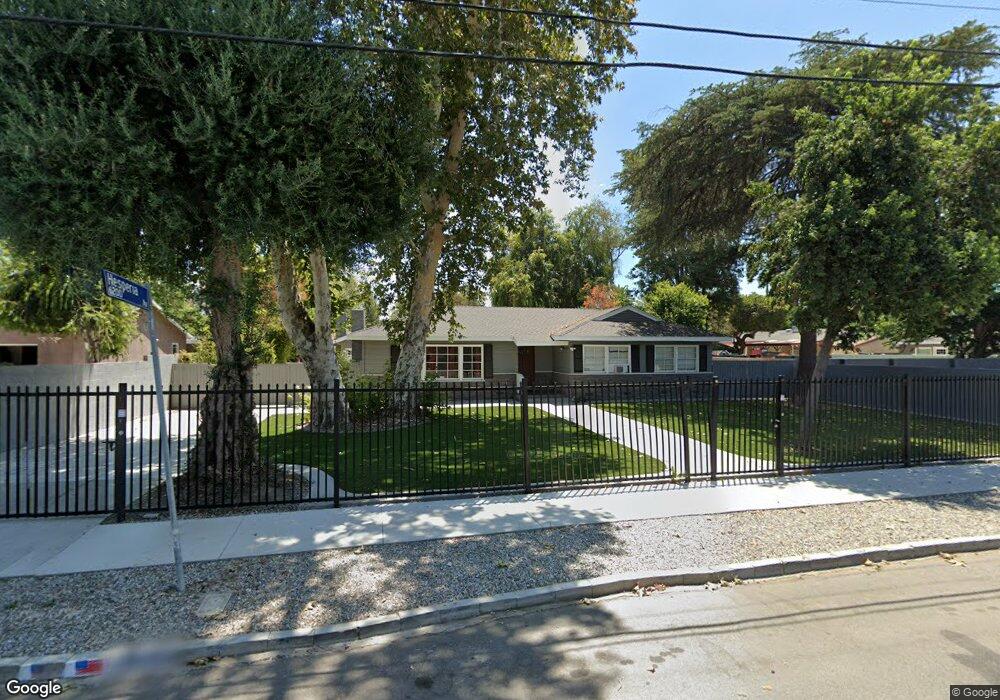
18050 Calvert St Encino, CA 91316
Estimated Value: $1,227,023 - $1,647,000
4
Beds
2
Baths
1,931
Sq Ft
$700/Sq Ft
Est. Value
About This Home
This home is located at 18050 Calvert St, Encino, CA 91316 and is currently estimated at $1,350,756, approximately $699 per square foot. 18050 Calvert St is a home located in Los Angeles County with nearby schools including Gaspar De Portola Middle School, Emelita Street Elementary, and Reseda High School.
Ownership History
Date
Name
Owned For
Owner Type
Purchase Details
Closed on
Jun 20, 2018
Sold by
Levi Evan and Levi Mia
Bought by
Lindley Calvert Llc
Current Estimated Value
Purchase Details
Closed on
Jul 26, 2017
Sold by
18050 Calvert Llc
Bought by
Levi Family Partnership Lp
Purchase Details
Closed on
Jul 10, 2015
Sold by
Benyamin Shirley and The Kamal & Shirley Benyamin F
Bought by
18050 Calvert Llc
Purchase Details
Closed on
Feb 21, 2002
Sold by
Benyamin Shirley
Bought by
Benyamin Shirley and The Kamal & Shirley Benyamin F
Purchase Details
Closed on
Jan 30, 1996
Sold by
Cohen Mehrdad H and Cohan Mehrdad H
Bought by
Benyamin Shirley
Purchase Details
Closed on
Jan 26, 1996
Sold by
Benyamin Kamal
Bought by
Benyamin Shirley
Purchase Details
Closed on
May 25, 1995
Sold by
Yeftadonay Jan
Bought by
Cohan Mehrdad H
Create a Home Valuation Report for This Property
The Home Valuation Report is an in-depth analysis detailing your home's value as well as a comparison with similar homes in the area
Home Values in the Area
Average Home Value in this Area
Purchase History
| Date | Buyer | Sale Price | Title Company |
|---|---|---|---|
| Lindley Calvert Llc | -- | None Available | |
| Levi Evan | -- | None Available | |
| Levi Family Partnership Lp | $1,260,000 | Fidelity National Title Co | |
| 18050 Calvert Llc | -- | None Available | |
| Benyamin Shirley | -- | -- | |
| Benyamin Shirley | -- | South Coast Title | |
| Benyamin Shirley | -- | South Coast Title Company | |
| Cohan Mehrdad H | -- | -- |
Source: Public Records
Tax History
| Year | Tax Paid | Tax Assessment Tax Assessment Total Assessment is a certain percentage of the fair market value that is determined by local assessors to be the total taxable value of land and additions on the property. | Land | Improvement |
|---|---|---|---|---|
| 2025 | $12,547 | $1,035,420 | $779,411 | $256,009 |
| 2024 | $12,547 | $1,015,119 | $764,129 | $250,990 |
| 2023 | $12,305 | $995,216 | $749,147 | $246,069 |
| 2022 | $11,734 | $975,703 | $734,458 | $241,245 |
| 2021 | $15,913 | $1,324,484 | $993,363 | $331,121 |
| 2019 | $15,436 | $1,285,200 | $963,900 | $321,300 |
| 2018 | $15,363 | $1,260,000 | $945,000 | $315,000 |
| 2016 | $3,019 | $231,535 | $140,326 | $91,209 |
| 2015 | $2,978 | $228,058 | $138,219 | $89,839 |
| 2014 | -- | $223,592 | $135,512 | $88,080 |
Source: Public Records
Map
Nearby Homes
- 6250 Lindley Ave
- 5945 Hesperia Ave
- 18019 Tiara St
- 17905 Bullock St
- 5921 Chimineas Ave
- 5822 Lindley Ave
- 17806 Erwin St
- 5785 Bertrand Ave
- 17900 Hatteras St
- 5741 Newcastle Ave
- 18350 Hatteras St Unit 123
- 18350 Hatteras St Unit 278
- 18350 Hatteras St Unit 253
- 18350 Hatteras St Unit 176
- 18350 Hatteras St Unit 248
- 18316 Hatteras St Unit 27
- 5727 Chimineas Ave
- 6438 Lindley Ave
- 5907 Encino Ave
- 5700 Etiwanda Ave Unit 105
- 18040 Calvert St
- 6134 Lindley Ave
- 6120 Lindley Ave
- 18034 Calvert St
- 6201 Hesperia Ave
- 6200 Hesperia Ave
- 18024 Calvert St
- 6207 Hesperia Ave
- 18067 Calvert St
- 6206 Hesperia Ave
- 18027 Topham St
- 18020 Calvert St
- 6215 Hesperia Ave
- 6129 Lindley Ave
- 6135 Lindley Ave
- 6123 Lindley Ave
- 6212 Hesperia Ave
- 6201 Newcastle Ave
- 6121 Lindley Ave
- 6207 Newcastle Ave
Your Personal Tour Guide
Ask me questions while you tour the home.