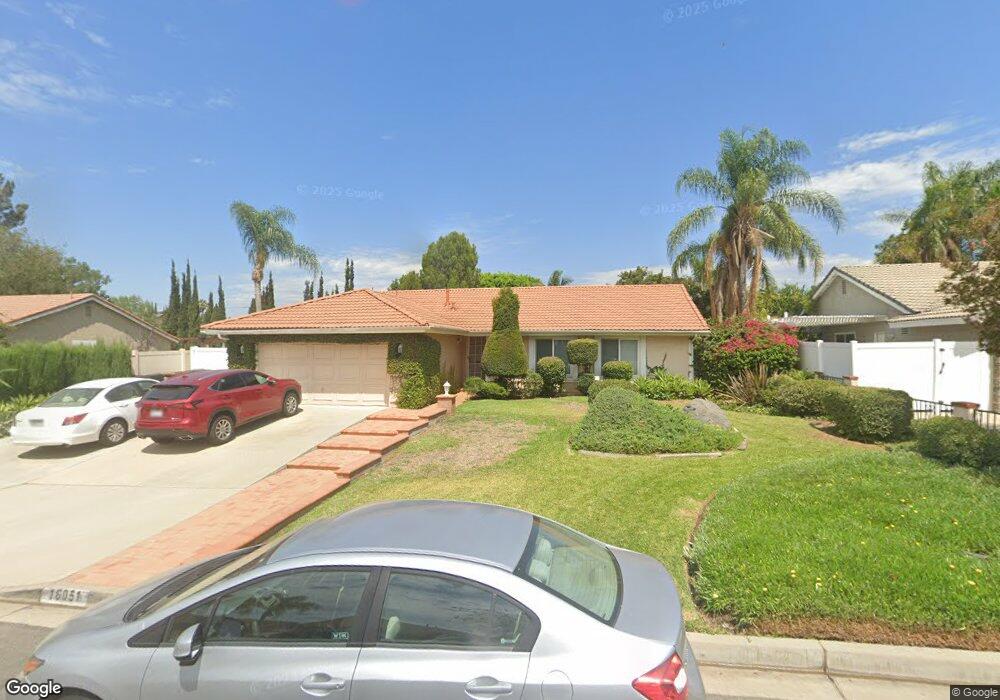
18051 Mark Ln Yorba Linda, CA 92886
Estimated Value: $1,053,000 - $1,218,000
3
Beds
2
Baths
1,340
Sq Ft
$855/Sq Ft
Est. Value
About This Home
This home is located at 18051 Mark Ln, Yorba Linda, CA 92886 and is currently estimated at $1,146,202, approximately $855 per square foot. 18051 Mark Ln is a home located in Orange County with nearby schools including Mabel M. Paine Elementary, Yorba Linda Middle School, and Yorba Linda High School.
Ownership History
Date
Name
Owned For
Owner Type
Purchase Details
Closed on
Jul 6, 2024
Sold by
Wrage Family Trust and Hollingsworth Linda
Bought by
Hollingsworth Family Trust and Hollingsworth
Current Estimated Value
Purchase Details
Closed on
Jul 27, 2021
Sold by
Wrage John W and Wrage Beverly J
Bought by
Wrage John W and Wrage Beverly J
Purchase Details
Closed on
Mar 16, 2010
Sold by
Wrage John W and Wrage Beverly J
Bought by
Wrage John W and Wrage Beverly J
Create a Home Valuation Report for This Property
The Home Valuation Report is an in-depth analysis detailing your home's value as well as a comparison with similar homes in the area
Home Values in the Area
Average Home Value in this Area
Purchase History
| Date | Buyer | Sale Price | Title Company |
|---|---|---|---|
| Hollingsworth Family Trust | -- | None Listed On Document | |
| Wrage John W | -- | None Available | |
| Wrage John W | -- | None Available |
Source: Public Records
Tax History Compared to Growth
Tax History
| Year | Tax Paid | Tax Assessment Tax Assessment Total Assessment is a certain percentage of the fair market value that is determined by local assessors to be the total taxable value of land and additions on the property. | Land | Improvement |
|---|---|---|---|---|
| 2025 | $1,952 | $616,704 | $502,281 | $114,423 |
| 2024 | $1,952 | $130,795 | $39,873 | $90,922 |
| 2023 | $1,901 | $128,231 | $39,091 | $89,140 |
| 2022 | $1,861 | $125,717 | $38,324 | $87,393 |
| 2021 | $1,821 | $123,252 | $37,572 | $85,680 |
| 2020 | $1,707 | $121,989 | $37,187 | $84,802 |
| 2019 | $1,656 | $119,598 | $36,458 | $83,140 |
| 2018 | $1,632 | $117,253 | $35,743 | $81,510 |
| 2017 | $1,605 | $114,954 | $35,042 | $79,912 |
| 2016 | $1,574 | $112,700 | $34,354 | $78,346 |
| 2015 | $1,553 | $111,008 | $33,838 | $77,170 |
| 2014 | $1,509 | $108,834 | $33,175 | $75,659 |
Source: Public Records
Map
Nearby Homes
- 4302 Eureka Ave
- 18302 Piper Place
- 18141 Bastanchury Rd
- 4317 Canyon Coral Ln
- 4845 Eisenhower Ct
- 18118 Joel Brattain Dr
- 18534 Cobblestone Ct
- 4891 Eureka Ave Unit 25
- 18211 Joel Brattain Dr
- 17781 Lerene Dr
- 18568 Arbor Gate Ln
- 18083 Burke Ln
- 18640 Seabiscuit Run
- 18044 Burke Ln
- 4760 Lakeview Ave
- 18665 Seabiscuit Run
- 4125 Temhurst Ct
- 4788 Lakeview Ave Unit 48
- 3880 Hogan Dr
- 18345 Watson Way