18058 Township Road 265 Kenton, OH 43326
Estimated Value: $195,000 - $279,000
3
Beds
1
Bath
2,400
Sq Ft
$99/Sq Ft
Est. Value
About This Home
This home is located at 18058 Township Road 265, Kenton, OH 43326 and is currently estimated at $237,000, approximately $98 per square foot. 18058 Township Road 265 is a home located in Hardin County with nearby schools including Ridgemont Elementary School, Ridgemont High School, and Hardin Community School.
Ownership History
Date
Name
Owned For
Owner Type
Purchase Details
Closed on
Dec 23, 2023
Sold by
Lambright David and Lambright Clara
Bought by
Yoder Perry and Yoder Mary
Current Estimated Value
Purchase Details
Closed on
Oct 9, 2018
Sold by
Lambright David and Lambright Clara
Bought by
Glenn Long Tammy and Glenn James
Home Financials for this Owner
Home Financials are based on the most recent Mortgage that was taken out on this home.
Original Mortgage
$105,000
Interest Rate
4.5%
Mortgage Type
Land Contract Argmt. Of Sale
Purchase Details
Closed on
Jun 9, 2015
Bought by
Lambright David and Lambright Clara
Purchase Details
Closed on
Jan 14, 1998
Bought by
Davis Ernie
Purchase Details
Closed on
Jan 18, 1994
Bought by
Flowers Dale Edwin
Purchase Details
Closed on
Jun 8, 1993
Bought by
Flowers Dale Edwin and Flowers Dar
Create a Home Valuation Report for This Property
The Home Valuation Report is an in-depth analysis detailing your home's value as well as a comparison with similar homes in the area
Home Values in the Area
Average Home Value in this Area
Purchase History
| Date | Buyer | Sale Price | Title Company |
|---|---|---|---|
| Yoder Perry | -- | None Listed On Document | |
| Glenn Long Tammy | $105,000 | None Available | |
| Lambright David | $115,000 | -- | |
| Davis Ernie | $70,500 | -- | |
| Flowers Dale Edwin | -- | -- | |
| Flowers Dale Edwin | -- | -- |
Source: Public Records
Mortgage History
| Date | Status | Borrower | Loan Amount |
|---|---|---|---|
| Previous Owner | Glenn Long Tammy | $105,000 |
Source: Public Records
Tax History Compared to Growth
Tax History
| Year | Tax Paid | Tax Assessment Tax Assessment Total Assessment is a certain percentage of the fair market value that is determined by local assessors to be the total taxable value of land and additions on the property. | Land | Improvement |
|---|---|---|---|---|
| 2024 | $3,395 | $90,350 | $10,380 | $79,970 |
| 2023 | $3,395 | $90,060 | $10,090 | $79,970 |
| 2022 | $3,148 | $76,990 | $9,530 | $67,460 |
| 2021 | $2,809 | $65,340 | $9,530 | $55,810 |
| 2020 | $2,813 | $65,340 | $9,530 | $55,810 |
| 2019 | $741 | $18,610 | $9,330 | $9,280 |
| 2018 | $743 | $18,610 | $9,330 | $9,280 |
| 2017 | $670 | $18,610 | $9,330 | $9,280 |
| 2016 | $611 | $16,940 | $8,800 | $8,140 |
| 2015 | $851 | $24,290 | $8,800 | $15,490 |
| 2014 | $888 | $24,290 | $8,800 | $15,490 |
| 2013 | $953 | $23,330 | $8,800 | $14,530 |
Source: Public Records
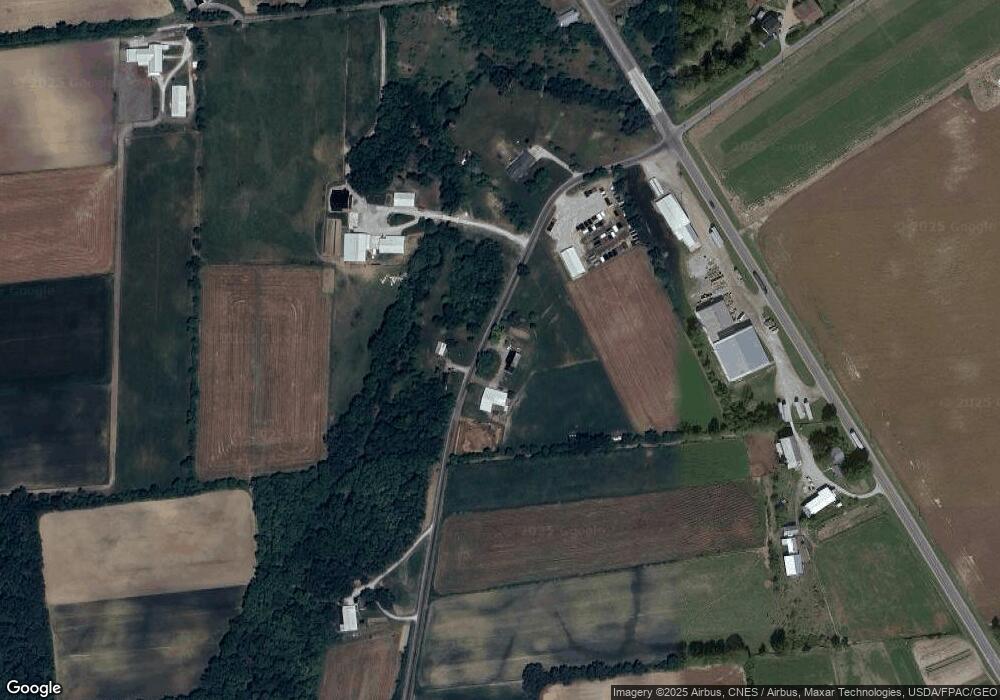
Map
Nearby Homes
- 13450 State Route 292
- 320 Letson Ave
- 11896 Parklane Dr
- 920 Cooper St
- 727 S Detroit St
- 639 S Main St
- 510 Decatur St
- 508 Decatur St
- 115 Scioto St
- 530 E Franklin St
- 414 Robinson Ave
- 513 E Franklin St
- 39 Grape St
- 79 Broadway St
- 121 S High St
- 210 N Main St
- 1 C Ct
- 509 E Carrol St
- 217 W Mansfield Rd
- 215 N Main St
- 18083 Tr Road 265
- 18083 Township Road 265
- 18083 Twprd
- 17971 Township Rd
- 17971 Township Road 265
- 18205 Tr 265
- 17971 Tr
- 16449 State Route 31
- 18312 Township Road 265
- 16653 State Route 31
- 15914 State Route 31
- 15845 State Route 31
- 16141 State Route 31
- 16804 State Route 31
- 16835 State Route 31
- 16869 State Route 31
- 16899 State Route 31
- 16066 Tr