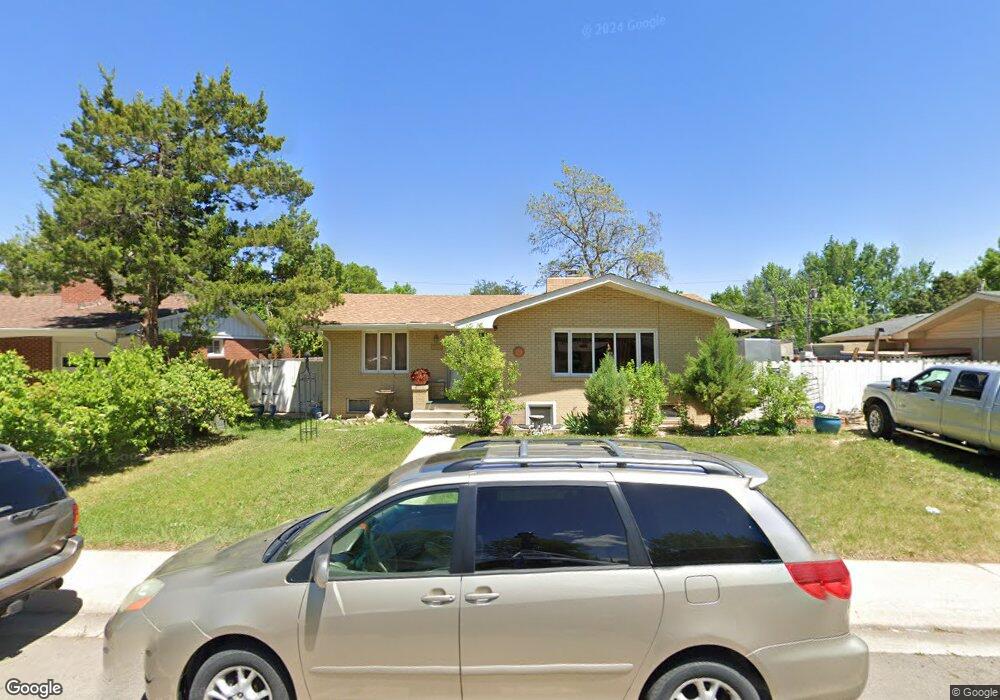
1806 Collyer St Longmont, CO 80501
Lanyon NeighborhoodEstimated Value: $446,530 - $490,000
2
Beds
3
Baths
2,745
Sq Ft
$174/Sq Ft
Est. Value
About This Home
This home is located at 1806 Collyer St, Longmont, CO 80501 and is currently estimated at $477,633, approximately $174 per square foot. 1806 Collyer St is a home located in Boulder County with nearby schools including Timberline Pk-8, Skyline High School, and Longmont Christian School.
Ownership History
Date
Name
Owned For
Owner Type
Purchase Details
Closed on
Nov 27, 2001
Sold by
Brown Christine A
Bought by
Delarosa Ricardo Gonzalez
Current Estimated Value
Home Financials for this Owner
Home Financials are based on the most recent Mortgage that was taken out on this home.
Original Mortgage
$196,713
Outstanding Balance
$76,980
Interest Rate
6.59%
Mortgage Type
FHA
Estimated Equity
$400,653
Purchase Details
Closed on
Apr 28, 2000
Sold by
Brown Brian W
Bought by
Brown Christine A
Purchase Details
Closed on
Apr 13, 2000
Sold by
Brown Brian W and Brown Christine A
Bought by
Brown Brian W
Purchase Details
Closed on
Jul 28, 1995
Sold by
Kelly Joseph Charles and Stubbert Kelly Cheryl Ann
Bought by
Brown Brian W
Home Financials for this Owner
Home Financials are based on the most recent Mortgage that was taken out on this home.
Original Mortgage
$128,850
Interest Rate
7.51%
Mortgage Type
FHA
Purchase Details
Closed on
Aug 11, 1993
Bought by
Gonzalez De La Rosa Ricardo
Create a Home Valuation Report for This Property
The Home Valuation Report is an in-depth analysis detailing your home's value as well as a comparison with similar homes in the area
Home Values in the Area
Average Home Value in this Area
Purchase History
| Date | Buyer | Sale Price | Title Company |
|---|---|---|---|
| Delarosa Ricardo Gonzalez | $199,800 | -- | |
| Brown Christine A | -- | -- | |
| Brown Brian W | -- | -- | |
| Brown Brian W | $131,000 | -- | |
| Gonzalez De La Rosa Ricardo | $93,000 | -- |
Source: Public Records
Mortgage History
| Date | Status | Borrower | Loan Amount |
|---|---|---|---|
| Open | Delarosa Ricardo Gonzalez | $196,713 | |
| Previous Owner | Brown Brian W | $128,850 |
Source: Public Records
Tax History
| Year | Tax Paid | Tax Assessment Tax Assessment Total Assessment is a certain percentage of the fair market value that is determined by local assessors to be the total taxable value of land and additions on the property. | Land | Improvement |
|---|---|---|---|---|
| 2025 | $2,496 | $27,844 | $8,075 | $19,769 |
| 2024 | $2,496 | $27,844 | $8,075 | $19,769 |
| 2023 | $2,462 | $26,097 | $8,971 | $20,810 |
| 2022 | $2,188 | $22,108 | $6,762 | $15,346 |
| 2021 | $2,216 | $22,744 | $6,957 | $15,787 |
| 2020 | $2,019 | $20,785 | $6,435 | $14,350 |
| 2019 | $1,987 | $20,785 | $6,435 | $14,350 |
| 2018 | $1,703 | $17,928 | $6,480 | $11,448 |
| 2017 | $1,680 | $19,820 | $7,164 | $12,656 |
| 2016 | $1,555 | $16,270 | $5,572 | $10,698 |
| 2015 | $1,482 | $13,683 | $4,219 | $9,464 |
| 2014 | $1,278 | $13,683 | $4,219 | $9,464 |
Source: Public Records
Map
Nearby Homes
- 1739 Collyer St
- 1820 Meadow Ln
- 1821 Meadow St
- 1635 Atwood St
- 1618 Centennial Dr
- 1551 Atwood St
- 1542 Collyer St
- 1530 Atwood St
- 117 Valentine Ln
- 50 19th Ave Unit 68
- 167 Mount Massive Way
- 1508 Atwood St
- 316 21st Ave
- 729 17th Ave Unit 15
- 729 17th Ave Unit 20
- 729 17th Ave Unit 23
- 729 17th Ave Unit 45
- 1424 Centennial Dr
- 1530 Terry St
- 1403 Emery St
- 1800 Collyer St
- 1808 Collyer St
- 1809 Atwood St
- 1803 Atwood St
- 1750 Collyer St
- 1815 Atwood St
- 1809 Collyer St
- 1818 Collyer St
- 1803 Collyer St
- 1751 Atwood St
- 1815 Collyer St
- 1821 Atwood St
- 1751 Collyer St
- 1745 Atwood St
- 1822 Collyer St
- 1744 Collyer St
- 1819 Collyer St
- 1827 Atwood St
- 1802 Corey St
- 1808 Corey St
Your Personal Tour Guide
Ask me questions while you tour the home.