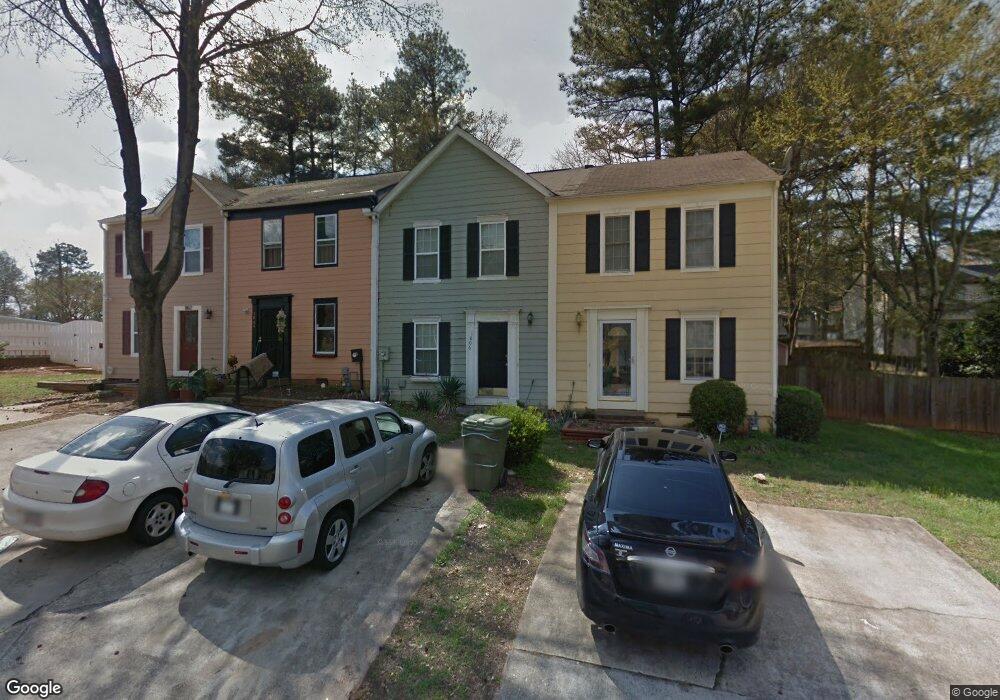
1806 Cumberland Valley Place SE Smyrna, GA 30080
Estimated Value: $203,000 - $231,726
2
Beds
2
Baths
1,152
Sq Ft
$193/Sq Ft
Est. Value
About This Home
This home is located at 1806 Cumberland Valley Place SE, Smyrna, GA 30080 and is currently estimated at $221,932, approximately $192 per square foot. 1806 Cumberland Valley Place SE is a home located in Cobb County with nearby schools including Smyrna Elementary School, Campbell Middle School, and Campbell High School.
Ownership History
Date
Name
Owned For
Owner Type
Purchase Details
Closed on
Aug 17, 2021
Sold by
Unknown
Bought by
Bethely Robert K
Current Estimated Value
Home Financials for this Owner
Home Financials are based on the most recent Mortgage that was taken out on this home.
Original Mortgage
$138,750
Outstanding Balance
$125,700
Interest Rate
2.8%
Mortgage Type
New Conventional
Estimated Equity
$96,232
Purchase Details
Closed on
Apr 4, 2008
Sold by
Mlmi Trust 2007-He3
Bought by
Bethely Robert
Purchase Details
Closed on
Dec 4, 2007
Sold by
Munoz Wilfredo
Bought by
Lasalle Bk Na
Purchase Details
Closed on
Jul 22, 1999
Sold by
Clark Ayanna O
Bought by
Battle Carolyn V
Home Financials for this Owner
Home Financials are based on the most recent Mortgage that was taken out on this home.
Original Mortgage
$69,821
Interest Rate
7.7%
Mortgage Type
FHA
Purchase Details
Closed on
Sep 27, 1996
Sold by
Billings Thomas
Bought by
Clark Ayanna Owens
Create a Home Valuation Report for This Property
The Home Valuation Report is an in-depth analysis detailing your home's value as well as a comparison with similar homes in the area
Home Values in the Area
Average Home Value in this Area
Purchase History
| Date | Buyer | Sale Price | Title Company |
|---|---|---|---|
| Bethely Robert K | -- | Mullick & Associates Llc | |
| Bethely Robert | $40,000 | -- | |
| Lasalle Bk Na | $81,510 | -- | |
| Battle Carolyn V | $70,200 | -- | |
| Clark Ayanna Owens | $57,000 | -- |
Source: Public Records
Mortgage History
| Date | Status | Borrower | Loan Amount |
|---|---|---|---|
| Open | Bethely Robert K | $138,750 | |
| Previous Owner | Battle Carolyn V | $69,821 | |
| Closed | Clark Ayanna Owens | $0 |
Source: Public Records
Tax History Compared to Growth
Tax History
| Year | Tax Paid | Tax Assessment Tax Assessment Total Assessment is a certain percentage of the fair market value that is determined by local assessors to be the total taxable value of land and additions on the property. | Land | Improvement |
|---|---|---|---|---|
| 2025 | $2,520 | $92,780 | $34,000 | $58,780 |
| 2024 | $2,396 | $88,200 | $34,000 | $54,200 |
| 2023 | $1,868 | $68,788 | $14,000 | $54,788 |
| 2022 | $1,882 | $68,788 | $14,000 | $54,788 |
| 2021 | $1,573 | $57,232 | $14,000 | $43,232 |
| 2020 | $1,215 | $44,200 | $14,000 | $30,200 |
| 2019 | $1,215 | $44,200 | $14,000 | $30,200 |
| 2018 | $878 | $31,948 | $8,000 | $23,948 |
| 2017 | $710 | $27,524 | $5,600 | $21,924 |
| 2016 | $644 | $24,988 | $4,800 | $20,188 |
| 2015 | $594 | $22,504 | $4,800 | $17,704 |
| 2014 | $442 | $16,572 | $0 | $0 |
Source: Public Records
Map
Nearby Homes
- 1799 Timber Valley Way SE
- 1944 Terri Meyer Dr SE
- 2791 Madison St SE
- 2683 Davenport St SE
- 2010 Glenroy Dr SE
- 1722 Wynndowne Trail SE
- 2627 Argo Dr SE
- 2613 Davenport St SE
- 1700 Wynndowne Trail SE Unit C
- 2654 Davenport St SE
- 1837 Lochlomand Ln SE
- 2051 Dundee Dr SE
- 1537 Springleaf Cove SE
- 1903 Lochlomand Ln SE
- 1876 Balmoral Rd SE
- 2781 Mathews St SE
- 2590 Bates St SE
- 1836 Lochlomand Ln SE
- 1808 Cumberland Valley Place SE
- 1804 Cumberland Valley Place SE Unit 1804
- 1804 Cumberland Valley Place SE
- 1804 Cumberland Valley Place SE Unit 2705
- 1804 Cumberland Valley Place SE
- 1802 Cumberland Valley Place SE
- 1802 Cumberland Valley Place SE
- 1818 Cumberland Valley Place SE
- 1705 Cumberland Valley Dr SE Unit 2
- 1703 Cumberland Valley Dr SE Unit 2
- 1707 Cumberland Valley Dr SE Unit 2
- 1701 Cumberland Valley Dr SE Unit 2
- 1820 Cumberland Valley Place SE
- 1822 Cumberland Valley Place SE Unit 4
- 1719 Cumberland Valley Dr SE
- 1824 Cumberland Valley Place SE
- 1723 Cumberland Valley Dr SE
- 1803 Cumberland Valley Place SE
- 1799 Cumberland Valley Place SE
- 1799 Cumberland Valley Place SE