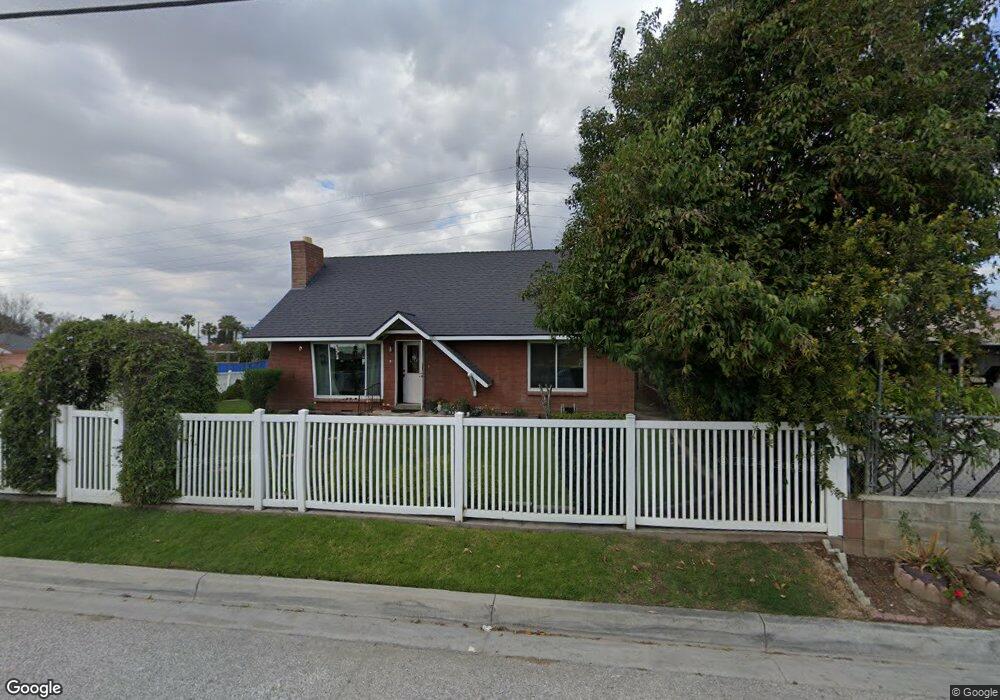
1806 E San Bernardino Ave San Bernardino, CA 92408
Riverview NeighborhoodEstimated Value: $421,000 - $511,000
2
Beds
1
Bath
1,149
Sq Ft
$403/Sq Ft
Est. Value
About This Home
This home is located at 1806 E San Bernardino Ave, San Bernardino, CA 92408 and is currently estimated at $463,342, approximately $403 per square foot. 1806 E San Bernardino Ave is a home with nearby schools including Victoria Elementary School, Beattie Middle School, and Redlands Senior High School.
Ownership History
Date
Name
Owned For
Owner Type
Purchase Details
Closed on
Dec 31, 1998
Sold by
Hud
Bought by
Belleau Susan G
Current Estimated Value
Home Financials for this Owner
Home Financials are based on the most recent Mortgage that was taken out on this home.
Original Mortgage
$78,453
Outstanding Balance
$18,150
Interest Rate
6.73%
Mortgage Type
FHA
Estimated Equity
$445,192
Purchase Details
Closed on
Oct 9, 1997
Sold by
Crowell Raymond E
Bought by
Countrywide Home Loans Inc
Purchase Details
Closed on
Jun 24, 1997
Sold by
Countrywide Home Loans Inc
Bought by
Hud
Purchase Details
Closed on
Jan 25, 1994
Sold by
Crowell Raymond Earl
Bought by
Crowell Raymond Earl
Home Financials for this Owner
Home Financials are based on the most recent Mortgage that was taken out on this home.
Original Mortgage
$60,974
Interest Rate
6.98%
Mortgage Type
FHA
Create a Home Valuation Report for This Property
The Home Valuation Report is an in-depth analysis detailing your home's value as well as a comparison with similar homes in the area
Home Values in the Area
Average Home Value in this Area
Purchase History
| Date | Buyer | Sale Price | Title Company |
|---|---|---|---|
| Belleau Susan G | $79,500 | Old Republic Title Company | |
| Countrywide Home Loans Inc | $56,822 | Landsafe Title | |
| Hud | -- | Landsafe Title | |
| Crowell Raymond Earl | -- | First American Title Ins Co |
Source: Public Records
Mortgage History
| Date | Status | Borrower | Loan Amount |
|---|---|---|---|
| Open | Belleau Susan G | $78,453 | |
| Previous Owner | Crowell Raymond Earl | $60,974 |
Source: Public Records
Tax History Compared to Growth
Tax History
| Year | Tax Paid | Tax Assessment Tax Assessment Total Assessment is a certain percentage of the fair market value that is determined by local assessors to be the total taxable value of land and additions on the property. | Land | Improvement |
|---|---|---|---|---|
| 2025 | $1,433 | $108,577 | $15,968 | $92,609 |
| 2024 | $1,433 | $106,448 | $15,655 | $90,793 |
| 2023 | $1,426 | $104,361 | $15,348 | $89,013 |
| 2022 | $1,403 | $102,315 | $15,047 | $87,268 |
| 2021 | $1,421 | $100,309 | $14,752 | $85,557 |
| 2020 | $1,398 | $99,281 | $14,601 | $84,680 |
| 2019 | $1,363 | $97,335 | $14,315 | $83,020 |
| 2018 | $1,333 | $95,426 | $14,034 | $81,392 |
| 2017 | $1,318 | $93,555 | $13,759 | $79,796 |
| 2016 | $1,301 | $91,720 | $13,489 | $78,231 |
| 2015 | $1,143 | $90,342 | $13,286 | $77,056 |
| 2014 | $1,123 | $88,573 | $13,026 | $75,547 |
Source: Public Records
Map
Nearby Homes
- 1677 E Cooley Ave
- 1965 E San Bernardino Ave
- 0 San Bernardino Ave Unit HD25178672
- 1815 Hardt St
- 1669 Elm Ave
- 1584 E Davidson St
- 1441 E Laurelwood Dr
- 1220 E Coulston St
- 1965 Coulston St Unit 62
- 1965 Coulston St Unit 19
- 1853 Raintree Place
- 1164 Gould St
- 1154 Gould St
- 0 E Brier Dr
- 1485 E Laurelwood Dr
- 10388 Mountain View Ave
- 25526 Redlands Blvd Unit 13
- 25526 Redlands Blvd Unit 100
- 30 Dart St
- 10613 Ohio St
- 1814 E San Bernardino Ave
- 1822 E San Bernardino Ave
- 0 San Bernardino Hwy Unit 38 120039837
- 1794 E San Bernardino Ave
- 9653 Sheddon Dr
- 1830 E San Bernardino Ave
- 1782 E San Bernardino Ave
- 1807 E San Bernardino Ave
- 1815 E San Bernardino Ave
- 1265 Sheddon Dr
- 1815 Wallace Ct
- 1776 Elm
- 1838 E San Bernardino Ave
- 1823 Wallace Ct
- 1260 Sheddon Dr
- 1768 E San Bernardino Ave
- 1831 Wallace Ct
- 1783 Wallace Ct
- 1831 E San Bernardino Ave
- 1795 E San Bernardino Ave