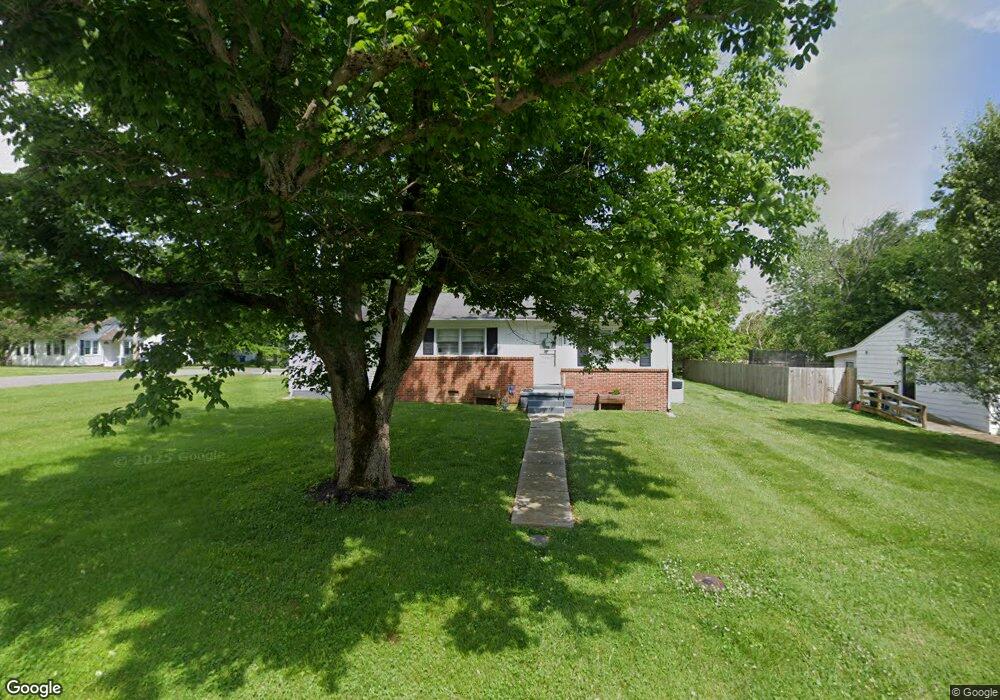
1806 Edmond Rd Shelbyville, TN 37160
Estimated Value: $147,000 - $213,000
2
Beds
1
Bath
840
Sq Ft
$210/Sq Ft
Est. Value
About This Home
This home is located at 1806 Edmond Rd, Shelbyville, TN 37160 and is currently estimated at $176,175, approximately $209 per square foot. 1806 Edmond Rd is a home located in Bedford County with nearby schools including Eakin Elementary School, Harris Middle School, and Victory Baptist Academy.
Ownership History
Date
Name
Owned For
Owner Type
Purchase Details
Closed on
Jul 21, 2021
Sold by
Landers Warren and Landers Dena K
Bought by
Ellis Kateland M
Current Estimated Value
Home Financials for this Owner
Home Financials are based on the most recent Mortgage that was taken out on this home.
Original Mortgage
$94,000
Outstanding Balance
$39,977
Interest Rate
2.96%
Mortgage Type
Future Advance Clause Open End Mortgage
Estimated Equity
$136,198
Purchase Details
Closed on
Feb 23, 2010
Sold by
Flippo Virginia
Bought by
Landers Warren
Home Financials for this Owner
Home Financials are based on the most recent Mortgage that was taken out on this home.
Original Mortgage
$41,205
Interest Rate
4.97%
Purchase Details
Closed on
Jun 24, 1996
Sold by
Cook Jesse Hull
Bought by
Junior Cook
Purchase Details
Closed on
Nov 14, 1959
Bought by
Cook Jesse Hull and Ethel Isabel
Create a Home Valuation Report for This Property
The Home Valuation Report is an in-depth analysis detailing your home's value as well as a comparison with similar homes in the area
Home Values in the Area
Average Home Value in this Area
Purchase History
| Date | Buyer | Sale Price | Title Company |
|---|---|---|---|
| Ellis Kateland M | $105,000 | None Available | |
| Landers Warren | $50,000 | -- | |
| Junior Cook | -- | -- | |
| Cook Jesse Hull | -- | -- |
Source: Public Records
Mortgage History
| Date | Status | Borrower | Loan Amount |
|---|---|---|---|
| Open | Ellis Kateland M | $94,000 | |
| Previous Owner | Cook Jesse Hull | $41,205 |
Source: Public Records
Tax History Compared to Growth
Tax History
| Year | Tax Paid | Tax Assessment Tax Assessment Total Assessment is a certain percentage of the fair market value that is determined by local assessors to be the total taxable value of land and additions on the property. | Land | Improvement |
|---|---|---|---|---|
| 2025 | -- | $25,075 | $0 | $0 |
| 2024 | -- | $25,075 | $8,000 | $17,075 |
| 2023 | $954 | $25,075 | $8,000 | $17,075 |
| 2022 | $982 | $25,075 | $8,000 | $17,075 |
| 2021 | $892 | $25,075 | $8,000 | $17,075 |
| 2020 | $686 | $25,075 | $8,000 | $17,075 |
| 2019 | $686 | $15,475 | $4,000 | $11,475 |
| 2018 | $670 | $15,475 | $4,000 | $11,475 |
| 2017 | $670 | $15,475 | $4,000 | $11,475 |
| 2016 | $664 | $15,475 | $4,000 | $11,475 |
| 2015 | $664 | $15,475 | $4,000 | $11,475 |
| 2014 | $600 | $15,318 | $0 | $0 |
Source: Public Records
Map
Nearby Homes
- 1804 Edmond Rd
- 306 Chestnut Dr
- 216 Chestnut Dr
- 225 Chestnut Dr
- 303 Rolling Rd
- 301 Rolling Rd
- 305 Chestnut Dr
- 223 Chestnut Dr
- 308 Chestnut Dr
- 305 Rolling Rd
- 219 Rolling Rd
- 307 Chestnut Dr
- 221 Chestnut Dr
- 214 Chestnut Dr
- 307 Rolling Rd
- 309 Chestnut Dr
- 310 Chestnut Dr
- 217 Rolling Rd
- 219 Chestnut Dr
- 1704 Edmond Rd