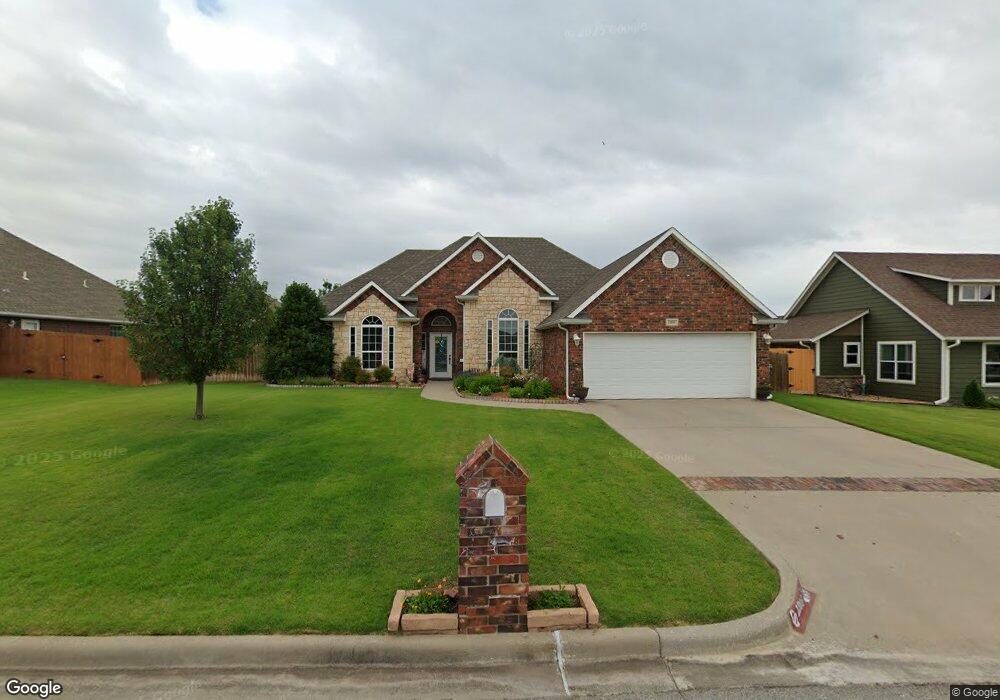
1806 Kaydence Dr Ardmore, OK 73401
Estimated Value: $276,000 - $311,000
2
Beds
2
Baths
1,790
Sq Ft
$162/Sq Ft
Est. Value
About This Home
This home is located at 1806 Kaydence Dr, Ardmore, OK 73401 and is currently estimated at $290,722, approximately $162 per square foot. 1806 Kaydence Dr is a home located in Carter County with nearby schools including Charles Evans Elementary School, Ardmore Middle School, and Ardmore High School.
Ownership History
Date
Name
Owned For
Owner Type
Purchase Details
Closed on
Jan 13, 2011
Sold by
Key Blly
Bought by
Wallace Shelly A
Current Estimated Value
Home Financials for this Owner
Home Financials are based on the most recent Mortgage that was taken out on this home.
Original Mortgage
$178,360
Outstanding Balance
$125,700
Interest Rate
5.5%
Mortgage Type
FHA
Estimated Equity
$165,022
Purchase Details
Closed on
Oct 6, 2009
Sold by
Texoma Land Development Llc
Bought by
Key Billy
Home Financials for this Owner
Home Financials are based on the most recent Mortgage that was taken out on this home.
Original Mortgage
$151,900
Interest Rate
5.16%
Mortgage Type
New Conventional
Purchase Details
Closed on
Sep 15, 2009
Sold by
Montgomery Linda
Bought by
Texoma Land Development Llc
Home Financials for this Owner
Home Financials are based on the most recent Mortgage that was taken out on this home.
Original Mortgage
$151,900
Interest Rate
5.16%
Mortgage Type
New Conventional
Create a Home Valuation Report for This Property
The Home Valuation Report is an in-depth analysis detailing your home's value as well as a comparison with similar homes in the area
Home Values in the Area
Average Home Value in this Area
Purchase History
| Date | Buyer | Sale Price | Title Company |
|---|---|---|---|
| Wallace Shelly A | $183,000 | -- | |
| Key Billy | $190,000 | -- | |
| Texoma Land Development Llc | -- | -- |
Source: Public Records
Mortgage History
| Date | Status | Borrower | Loan Amount |
|---|---|---|---|
| Open | Wallace Shelly A | $178,360 | |
| Previous Owner | Key Billy | $151,900 |
Source: Public Records
Tax History Compared to Growth
Tax History
| Year | Tax Paid | Tax Assessment Tax Assessment Total Assessment is a certain percentage of the fair market value that is determined by local assessors to be the total taxable value of land and additions on the property. | Land | Improvement |
|---|---|---|---|---|
| 2024 | $2,988 | $28,501 | $3,000 | $25,501 |
| 2023 | $2,845 | $27,144 | $3,000 | $24,144 |
| 2022 | $2,471 | $25,851 | $3,000 | $22,851 |
| 2021 | $2,484 | $24,621 | $3,000 | $21,621 |
| 2020 | $2,331 | $23,448 | $3,000 | $20,448 |
| 2019 | $2,208 | $22,737 | $2,820 | $19,917 |
| 2018 | $2,248 | $22,771 | $2,634 | $20,137 |
| 2017 | $2,031 | $22,215 | $2,634 | $19,581 |
| 2016 | $2,067 | $22,176 | $2,634 | $19,542 |
| 2015 | $1,692 | $22,028 | $2,634 | $19,394 |
| 2014 | $2,025 | $22,629 | $2,634 | $19,995 |
Source: Public Records
Map
Nearby Homes
- 1802 Kendall Dr
- 1620 Shenandoah Dr
- 1717 Red Oak Dr
- 1017 Maxwell St NW
- 1410 Brookview Dr
- 1405 Brookview Dr
- 1496 US Highway 77
- 1302 Brookview Dr
- 1029 Northwest Blvd
- 1626 N Cedar Loop
- 923 Maxwell St NW
- 912 Elm St
- 912 Maxwell St NW
- 1216 11th Ave NW
- 1919 10th Ave NW
- 1115 Osage St
- 809 Campbell St
- 1907 Robison St
- 1111 Prairie Valley Rd
- 2026 11th Ave NW
- 1806 Kaydence Ln
- 1810 Kaydence Ln
- 1802 Kaydence Dr
- 1810 Kaydence Dr
- 1821 Kendall Dr
- 1825 Kendall Dr
- 1817 Kendall Dr
- 1807 Kaydence Dr
- 1801 Kaydence Dr
- 1829 Kendall Dr
- 1813 Kaydence Dr
- 1812 Kendall Dr
- 1833 Kendall Dr
- 1810 Kendall Dr
- 1814 Kendall Dr
- 1803 Kendall Dr
- 1824 Kendall Dr
- 1702 Lisa Ln
- 1822 Kendall Dr