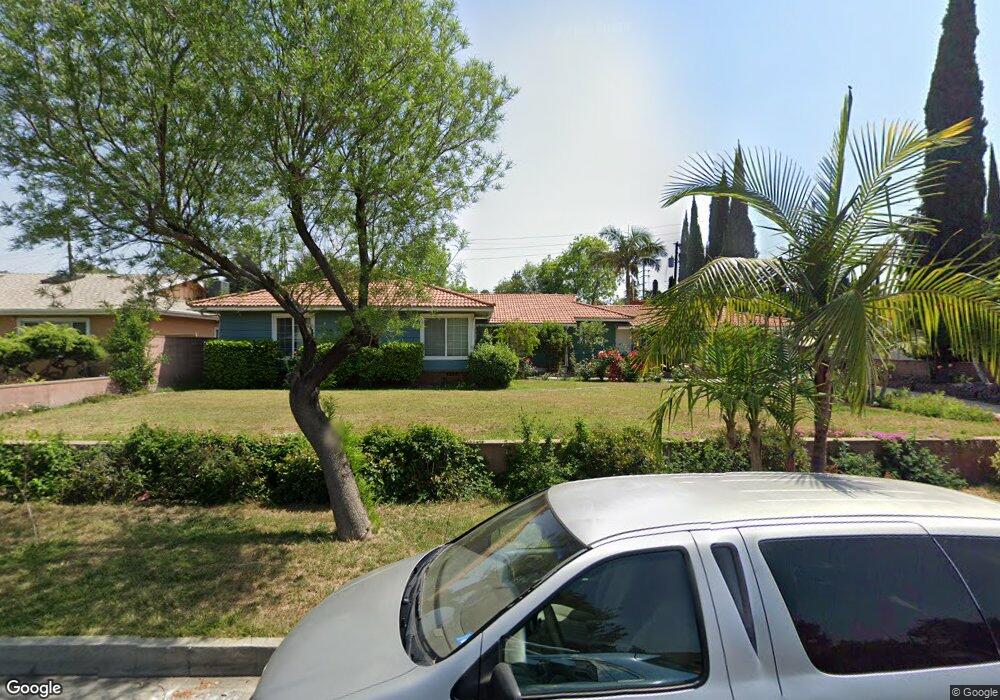
1806 Rio de Oro Dr West Covina, CA 91791
South Hills NeighborhoodEstimated Value: $875,000 - $1,214,000
4
Beds
2
Baths
1,996
Sq Ft
$516/Sq Ft
Est. Value
About This Home
This home is located at 1806 Rio de Oro Dr, West Covina, CA 91791 and is currently estimated at $1,030,756, approximately $516 per square foot. 1806 Rio de Oro Dr is a home located in Los Angeles County with nearby schools including Vine Elementary School, Hollencrest Middle School, and West Covina High School.
Ownership History
Date
Name
Owned For
Owner Type
Purchase Details
Closed on
Jul 17, 2024
Sold by
Phan Tony Tan
Bought by
Phan Tony Tan and Truong Khanh Thi
Current Estimated Value
Purchase Details
Closed on
Jun 1, 2009
Sold by
Phan Tony Tan and Le Lisa Tuyet
Bought by
Phan Tony Tan
Purchase Details
Closed on
Apr 11, 2000
Sold by
Hanenkrat Lymond W and Hanenkrat Juanita
Bought by
Phan Tony
Home Financials for this Owner
Home Financials are based on the most recent Mortgage that was taken out on this home.
Original Mortgage
$183,200
Interest Rate
8.22%
Purchase Details
Closed on
Mar 16, 2000
Sold by
Carder Diana and Sullenger Diana Carder
Bought by
Hanenkrat Lymond W
Home Financials for this Owner
Home Financials are based on the most recent Mortgage that was taken out on this home.
Original Mortgage
$183,200
Interest Rate
8.22%
Create a Home Valuation Report for This Property
The Home Valuation Report is an in-depth analysis detailing your home's value as well as a comparison with similar homes in the area
Home Values in the Area
Average Home Value in this Area
Purchase History
| Date | Buyer | Sale Price | Title Company |
|---|---|---|---|
| Phan Tony Tan | -- | None Listed On Document | |
| Phan Tony Tan | -- | None Available | |
| Phan Tony | $229,000 | Chicago Title Co | |
| Hanenkrat Lymond W | $150,000 | Chicago Title Co |
Source: Public Records
Mortgage History
| Date | Status | Borrower | Loan Amount |
|---|---|---|---|
| Previous Owner | Phan Tony | $183,200 |
Source: Public Records
Tax History Compared to Growth
Tax History
| Year | Tax Paid | Tax Assessment Tax Assessment Total Assessment is a certain percentage of the fair market value that is determined by local assessors to be the total taxable value of land and additions on the property. | Land | Improvement |
|---|---|---|---|---|
| 2025 | $4,527 | $351,942 | $181,656 | $170,286 |
| 2024 | $4,527 | $345,043 | $178,095 | $166,948 |
| 2023 | $4,309 | $338,278 | $174,603 | $163,675 |
| 2022 | $4,339 | $331,646 | $171,180 | $160,466 |
| 2021 | $4,213 | $325,144 | $167,824 | $157,320 |
| 2019 | $4,099 | $315,502 | $162,848 | $152,654 |
| 2018 | $3,902 | $309,316 | $159,655 | $149,661 |
| 2016 | $3,559 | $297,306 | $153,456 | $143,850 |
| 2015 | $3,490 | $292,841 | $151,151 | $141,690 |
| 2014 | $3,474 | $287,106 | $148,191 | $138,915 |
Source: Public Records
Map
Nearby Homes
- 1408 Millcreek
- 1306 S Cajon Ave
- 1300 S Fleetwell Ave
- 1663 Caffrey Ln
- 1517 Mccabe Way
- 1495 Mccabe Way
- 1516 Wimbledon Ct
- 1450 Westcastle
- 1623 E Francisquito Ave
- 1507 Elkwood Dr Unit 61
- 2043 Abrazo Dr
- 1408 Queen Summit Dr
- 1937 Jacaranda St
- 1635 Park Vista Way
- 17040 E Holton St
- 1828 Scenic View Cir
- 1515 S Westridge Rd
- 910 S Donna Beth Ave
- 1501 S Alpine Dr
- 859 S Hillward Ave
- 1810 Rio de Oro Dr
- 1802 Rio de Oro Dr
- 1814 Rio de Oro Dr
- 1805 Rio de Oro Dr
- 1809 Rio de Oro Dr
- 1801 Rio de Oro Dr
- 0 Confidential Unit CC53983
- 0 Confidential Unit CC244748
- 1813 Rio de Oro Dr
- 1818 Rio de Oro Dr
- 1812 E Cajon Cir
- 1817 Rio de Oro Dr
- 1820 E Cajon Cir
- 1804 E Cajon Cir
- 1828 E Cajon Cir
- 1347 S Azusa Ave
- 1822 Rio de Oro Dr
- 1335 S Azusa Ave
- 1834 E Cajon Cir
- 1821 Rio de Oro Dr