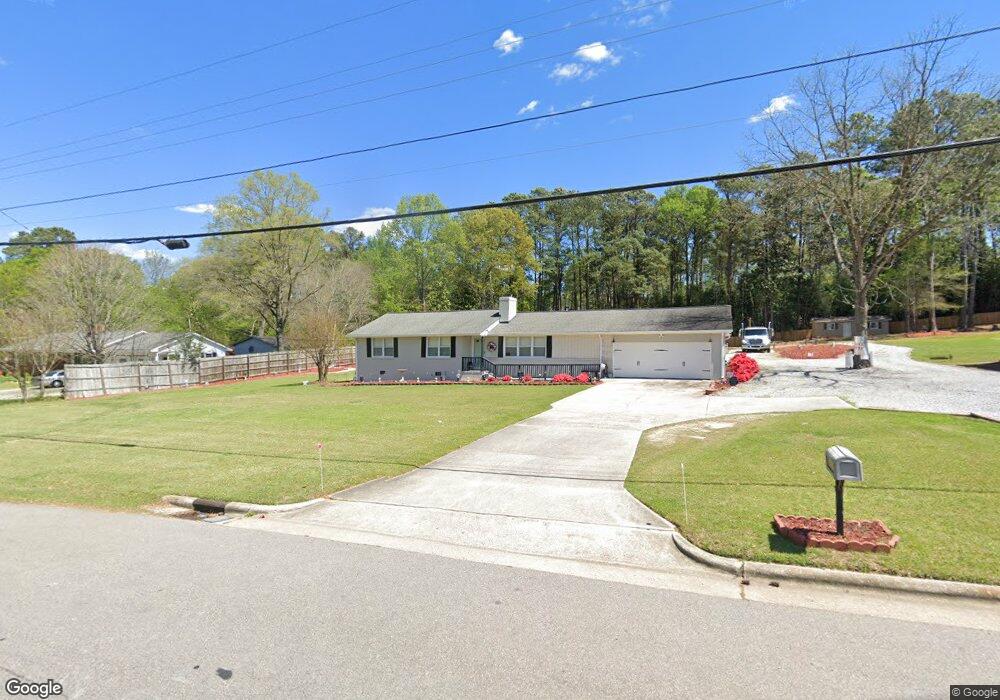
1806 Trawick Rd Raleigh, NC 27604
Northeast Raleigh NeighborhoodEstimated Value: $347,000 - $428,000
--
Bed
2
Baths
1,456
Sq Ft
$260/Sq Ft
Est. Value
About This Home
This home is located at 1806 Trawick Rd, Raleigh, NC 27604 and is currently estimated at $377,873, approximately $259 per square foot. 1806 Trawick Rd is a home located in Wake County with nearby schools including Wilburn Elementary, Durant Road Middle, and Millbrook High School.
Ownership History
Date
Name
Owned For
Owner Type
Purchase Details
Closed on
Aug 27, 2025
Sold by
Case Dawn Canipe and Case Paul B
Bought by
Canipe Case Dawn and Case Paul B
Current Estimated Value
Home Financials for this Owner
Home Financials are based on the most recent Mortgage that was taken out on this home.
Original Mortgage
$80,000
Outstanding Balance
$80,000
Interest Rate
6.75%
Mortgage Type
Credit Line Revolving
Estimated Equity
$297,873
Purchase Details
Closed on
Jun 21, 2012
Sold by
Canipe Russell L and Canipe Retha Ellen S
Bought by
Case Dawn Canipe
Purchase Details
Closed on
May 9, 2012
Sold by
Blackburn David H and Blackburn Terry L
Bought by
Canipe Russell L and Canipe Retha Ellen S
Purchase Details
Closed on
Apr 6, 2011
Sold by
Blackburn David Herrell and Blackburn David Harold
Bought by
Blackburn David Herrell and Blackburn Terry L
Create a Home Valuation Report for This Property
The Home Valuation Report is an in-depth analysis detailing your home's value as well as a comparison with similar homes in the area
Home Values in the Area
Average Home Value in this Area
Purchase History
| Date | Buyer | Sale Price | Title Company |
|---|---|---|---|
| Canipe Case Dawn | -- | None Listed On Document | |
| Case Dawn Canipe | -- | None Available | |
| Canipe Russell L | $200,000 | None Available | |
| Blackburn David Herrell | -- | None Available |
Source: Public Records
Mortgage History
| Date | Status | Borrower | Loan Amount |
|---|---|---|---|
| Open | Canipe Case Dawn | $80,000 |
Source: Public Records
Tax History Compared to Growth
Tax History
| Year | Tax Paid | Tax Assessment Tax Assessment Total Assessment is a certain percentage of the fair market value that is determined by local assessors to be the total taxable value of land and additions on the property. | Land | Improvement |
|---|---|---|---|---|
| 2025 | $2,530 | $392,494 | $131,250 | $261,244 |
| 2024 | $2,457 | $392,494 | $131,250 | $261,244 |
| 2023 | $1,678 | $212,676 | $70,000 | $142,676 |
| 2022 | $1,556 | $212,676 | $70,000 | $142,676 |
| 2021 | $1,514 | $212,676 | $70,000 | $142,676 |
| 2020 | $1,490 | $212,676 | $70,000 | $142,676 |
| 2019 | $1,505 | $181,860 | $72,500 | $109,360 |
| 2018 | $1,385 | $181,860 | $72,500 | $109,360 |
| 2017 | $1,313 | $181,860 | $72,500 | $109,360 |
| 2016 | $1,287 | $181,860 | $72,500 | $109,360 |
| 2015 | $1,260 | $178,484 | $77,500 | $100,984 |
| 2014 | $1,194 | $178,484 | $77,500 | $100,984 |
Source: Public Records
Map
Nearby Homes
- 4225 Lake Woodard Dr
- 1809 Billingham Ct
- 1340 Beacon Village Dr
- 3521 Piedmont Dr
- 2023 Seneca Dr
- 2316 Carthage Cir
- 4212 Beacon Crest Way
- 1431 Beacon Village Dr
- 4255 Lake Woodard Dr
- 3601 Elm Grove Ln
- 3607 Elm Grove Ln
- 2108 Carthage Cir
- Ellerbe Plan at Piedmont Point
- 3455 Piedmont Dr
- 2209 Dobbin Place
- 2103 Kilburn Rd
- 3426 Skycrest Dr
- 2311 Oakwood Meadows Ct
- 2301 Oakwood Meadows Ct
- 2307 Oakwood Meadows Ct
- 1800 Trawick Rd
- 1812 Trawick Rd
- 1816 Trawick Rd
- 3752 Votive Ln
- 3754 Votive Ln
- 3756 Votive Ln
- 3750 Votive Ln
- 3745 Votive Ln
- 3736 Votive Ln
- 3743 Votive Ln
- 3734 Votive Ln
- 3732 Votive Ln
- 3741 Votive Ln
- 3730 Votive Ln
- 3725 Votive Ln
- 1802 Trawick Rd
- 3716 Votive Ln
- 3723 Votive Ln
- 3714 Votive Ln
- 3721 Votive Ln