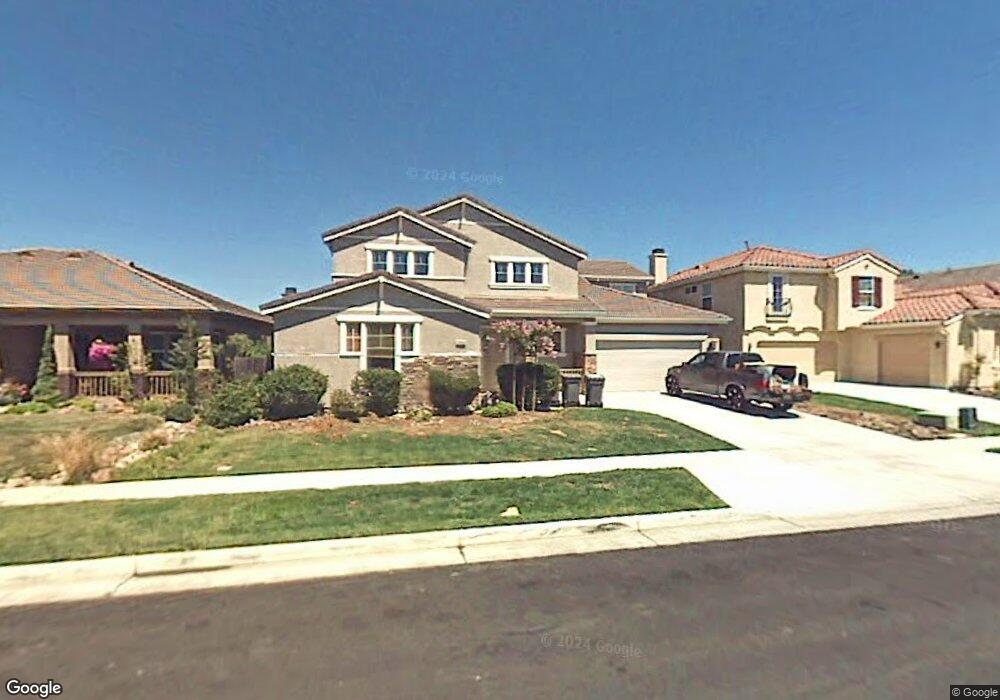
1806 Trinity Way West Sacramento, CA 95691
Southport NeighborhoodEstimated Value: $556,000 - $782,000
4
Beds
3
Baths
3,020
Sq Ft
$237/Sq Ft
Est. Value
About This Home
This home is located at 1806 Trinity Way, West Sacramento, CA 95691 and is currently estimated at $714,679, approximately $236 per square foot. 1806 Trinity Way is a home located in Yolo County with nearby schools including Stonegate Elementary School, River City High, and Our Lady Of Grace.
Ownership History
Date
Name
Owned For
Owner Type
Purchase Details
Closed on
Jul 29, 2011
Sold by
Gmac Mortgage Llc
Bought by
Will Christina and Novak Matthew
Current Estimated Value
Home Financials for this Owner
Home Financials are based on the most recent Mortgage that was taken out on this home.
Original Mortgage
$279,236
Outstanding Balance
$192,345
Interest Rate
4.46%
Mortgage Type
Purchase Money Mortgage
Estimated Equity
$522,334
Purchase Details
Closed on
Sep 30, 2010
Sold by
Arzaluz Geronimo and Arzaluz Tisha V
Bought by
Gmac Mortgage Llc and Gmac Mortgage Corporation
Purchase Details
Closed on
Nov 11, 2002
Sold by
Pacific Mountain Partners Llc
Bought by
Arzaluz Geronimo and Arzaluz Tisha V
Home Financials for this Owner
Home Financials are based on the most recent Mortgage that was taken out on this home.
Original Mortgage
$264,000
Interest Rate
6.12%
Create a Home Valuation Report for This Property
The Home Valuation Report is an in-depth analysis detailing your home's value as well as a comparison with similar homes in the area
Home Values in the Area
Average Home Value in this Area
Purchase History
| Date | Buyer | Sale Price | Title Company |
|---|---|---|---|
| Will Christina | $263,000 | Fidelity National Title Comp | |
| Gmac Mortgage Llc | $283,500 | Accommodation | |
| Arzaluz Geronimo | $333,000 | Placer Title |
Source: Public Records
Mortgage History
| Date | Status | Borrower | Loan Amount |
|---|---|---|---|
| Open | Will Christina | $279,236 | |
| Previous Owner | Arzaluz Geronimo | $264,000 | |
| Closed | Arzaluz Geronimo | $49,500 |
Source: Public Records
Tax History Compared to Growth
Tax History
| Year | Tax Paid | Tax Assessment Tax Assessment Total Assessment is a certain percentage of the fair market value that is determined by local assessors to be the total taxable value of land and additions on the property. | Land | Improvement |
|---|---|---|---|---|
| 2025 | $4,104 | $330,328 | $81,637 | $248,691 |
| 2023 | $4,104 | $317,503 | $78,468 | $239,035 |
| 2022 | $3,831 | $311,279 | $76,930 | $234,349 |
| 2021 | $3,798 | $305,176 | $75,422 | $229,754 |
| 2020 | $3,622 | $302,048 | $74,649 | $227,399 |
| 2019 | $3,579 | $296,127 | $73,186 | $222,941 |
| 2018 | $3,512 | $290,321 | $71,751 | $218,570 |
| 2017 | $3,477 | $284,630 | $70,345 | $214,285 |
| 2016 | $3,426 | $279,050 | $68,966 | $210,084 |
| 2015 | $3,102 | $274,860 | $67,931 | $206,929 |
| 2014 | $3,102 | $269,477 | $66,601 | $202,876 |
Source: Public Records
Map
Nearby Homes
- 1840 Sierra Rd
- 3111 Lassen St
- 2764 Rogue River Cir
- 1675 Greenbrier Rd
- 2625 Malibu Ct
- 4580 S River Rd
- 209 Touchstone Place
- 0 Jefferson Blvd Unit 225119728
- 2568 Barona Ct
- 235 Touchstone Place
- 3085 Parella Ct
- The Baltic Plan at The Estates at Newport
- The Caspian Plan at The Estates at Newport
- The Dawson Plan at The Estates at Newport
- The Argo Plan at The Estates at Newport
- 2825 Elderberry St
- 2975 Jefferson Blvd
- 2455 Barona St
- 2768 Moonflower St
- 2750 Moonflower St
- 1818 Trinity Way
- 1794 Trinity Way
- 3019 Rubicon Way
- 3011 Rubicon Way
- 3027 Rubicon Way
- 1830 Trinity Way
- 1782 Trinity Way
- 1807 Trinity Way
- 3035 Rubicon Way
- 1795 Trinity Way
- 1819 Trinity Way
- 3003 Rubicon Way
- 1770 Trinity Way
- 1783 Trinity Way
- 1831 Trinity Way
- 3043 Rubicon Way
- 2995 Rubicon Way
- 1771 Trinity Way
- 2988 Rubicon Way
- 1843 Trinity Way