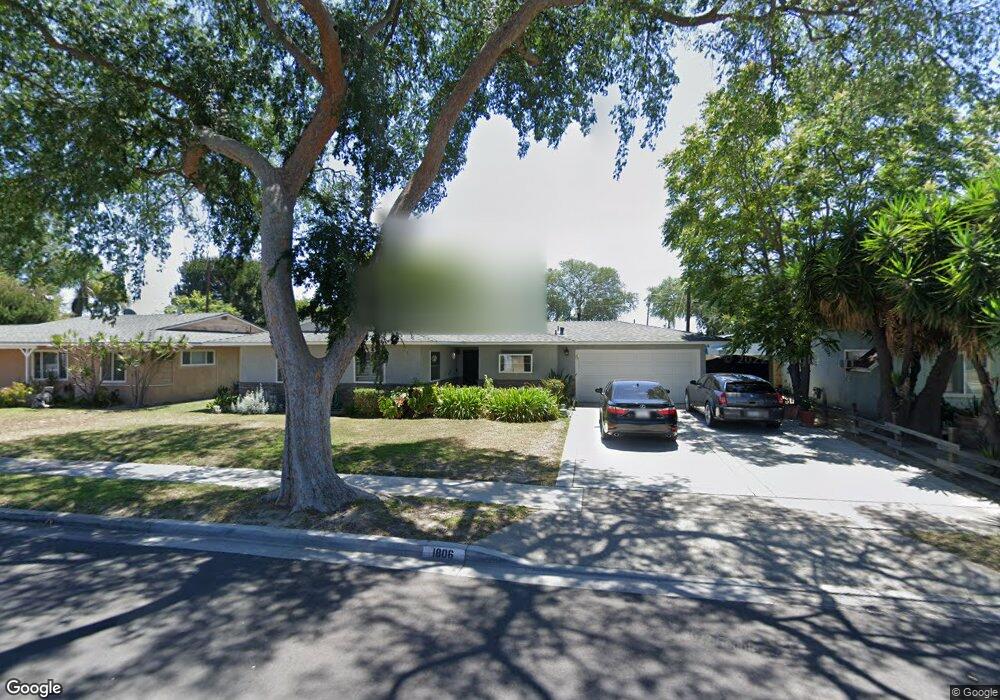
1806 W Bernardy Place Anaheim, CA 92804
Hermosa Village NeighborhoodEstimated Value: $910,701 - $1,132,000
4
Beds
3
Baths
1,682
Sq Ft
$599/Sq Ft
Est. Value
About This Home
This home is located at 1806 W Bernardy Place, Anaheim, CA 92804 and is currently estimated at $1,007,175, approximately $598 per square foot. 1806 W Bernardy Place is a home located in Orange County with nearby schools including James Madison Elementary School, Ball Junior High School, and Loara High School.
Ownership History
Date
Name
Owned For
Owner Type
Purchase Details
Closed on
Sep 27, 2016
Sold by
Cooper Dana Lynn
Bought by
Cooper Dana Lynn and The Dana Lynn Cooper Revocable Trust
Current Estimated Value
Purchase Details
Closed on
Mar 28, 2008
Sold by
Cooper Dana and Cooper Ralph
Bought by
Cooper Dana
Home Financials for this Owner
Home Financials are based on the most recent Mortgage that was taken out on this home.
Original Mortgage
$200,000
Outstanding Balance
$128,334
Interest Rate
6.22%
Mortgage Type
New Conventional
Estimated Equity
$878,841
Purchase Details
Closed on
Apr 5, 2001
Sold by
Cooper Dana
Bought by
Cooper Ralph and Cooper Dana
Home Financials for this Owner
Home Financials are based on the most recent Mortgage that was taken out on this home.
Original Mortgage
$15,000
Interest Rate
7.09%
Mortgage Type
Credit Line Revolving
Purchase Details
Closed on
Jul 15, 1999
Sold by
Ralph Cooper
Bought by
Cooper Dana
Purchase Details
Closed on
Aug 13, 1997
Sold by
Ramon Daniel and Ramon Lydia C
Bought by
Cooper Ralph and Cooper Dana
Home Financials for this Owner
Home Financials are based on the most recent Mortgage that was taken out on this home.
Original Mortgage
$153,710
Interest Rate
7.43%
Create a Home Valuation Report for This Property
The Home Valuation Report is an in-depth analysis detailing your home's value as well as a comparison with similar homes in the area
Home Values in the Area
Average Home Value in this Area
Purchase History
| Date | Buyer | Sale Price | Title Company |
|---|---|---|---|
| Cooper Dana Lynn | -- | None Available | |
| Cooper Dana | -- | Service Link | |
| Cooper Ralph | -- | Stewart Title | |
| Cooper Dana | -- | -- | |
| Cooper Ralph | $162,000 | American Title Co |
Source: Public Records
Mortgage History
| Date | Status | Borrower | Loan Amount |
|---|---|---|---|
| Open | Cooper Dana | $200,000 | |
| Closed | Cooper Ralph | $15,000 | |
| Closed | Cooper Ralph | $153,710 |
Source: Public Records
Tax History Compared to Growth
Tax History
| Year | Tax Paid | Tax Assessment Tax Assessment Total Assessment is a certain percentage of the fair market value that is determined by local assessors to be the total taxable value of land and additions on the property. | Land | Improvement |
|---|---|---|---|---|
| 2025 | $3,097 | $258,344 | $188,503 | $69,841 |
| 2024 | $3,097 | $253,279 | $184,807 | $68,472 |
| 2023 | $3,028 | $248,313 | $181,183 | $67,130 |
| 2022 | $2,986 | $243,445 | $177,631 | $65,814 |
| 2021 | $2,987 | $238,672 | $174,148 | $64,524 |
| 2020 | $2,973 | $236,225 | $172,362 | $63,863 |
| 2019 | $2,888 | $231,594 | $168,983 | $62,611 |
| 2018 | $2,828 | $227,053 | $165,669 | $61,384 |
| 2017 | $2,720 | $222,601 | $162,420 | $60,181 |
| 2016 | $2,709 | $218,237 | $159,236 | $59,001 |
| 2015 | $2,683 | $214,959 | $156,844 | $58,115 |
| 2014 | $2,522 | $210,749 | $153,772 | $56,977 |
Source: Public Records
Map
Nearby Homes
- 1700 W Cerritos Ave Unit 216
- 1944 W Lullaby Ln
- 1675 W Mells Ln
- 1645 S Euclid St
- 1616 S Euclid St Unit 100
- 1616 S Euclid St Unit 75
- 1616 S Euclid St Unit 54
- 1616 S Euclid St Unit 23
- 2011 W Katella Ave Unit 61
- 1350 S Ashington Ln
- 1768 W Juno Ave
- 10622 Tibbs Cir
- 1531 W Doris Place
- 930 S Emerald St
- 1564 W Palais Rd
- 906 S Fann St
- 1737 S Garden Dr
- 902 S Fann St
- 1537 W Harriet Ln
- 1629 W Ball Rd
- 1802 W Bernardy Place
- 1812 W Bernardy Place
- 1807 W Harle Ave
- 1803 W Harle Ave
- 1813 W Harle Ave
- 1816 W Bernardy Place
- 1809 W Bernardy Place
- 1803 W Bernardy Place
- 1817 W Harle Ave
- 1815 W Bernardy Place
- 1820 W Bernardy Place
- 1821 W Harle Ave
- 1821 W Bernardy Place
- 1806 W Harle Ave
- 1808 W Cerritos Ave
- 1812 W Harle Ave
- 1802 W Cerritos Ave
- 1826 W Bernardy Place
- 1814 W Cerritos Ave
- 1816 W Harle Ave