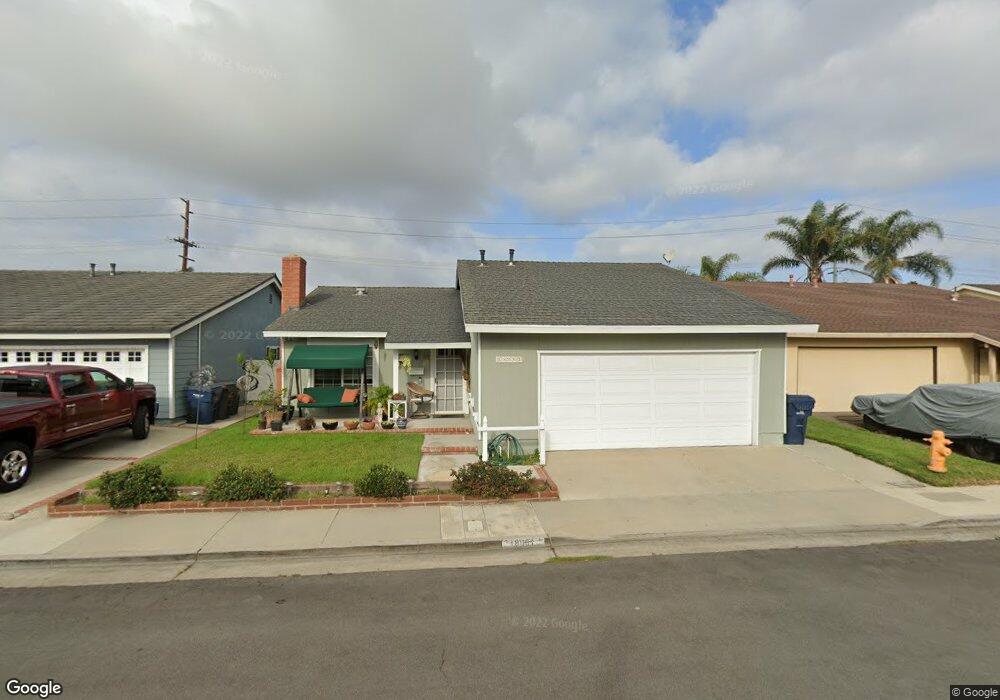
18061 Clearwater Cir Huntington Beach, CA 92648
Estimated Value: $1,110,127 - $1,272,000
3
Beds
2
Baths
1,138
Sq Ft
$1,068/Sq Ft
Est. Value
About This Home
This home is located at 18061 Clearwater Cir, Huntington Beach, CA 92648 and is currently estimated at $1,215,782, approximately $1,068 per square foot. 18061 Clearwater Cir is a home located in Orange County with nearby schools including Hope View Elementary School, Mesa View Middle School, and Ocean View High.
Ownership History
Date
Name
Owned For
Owner Type
Purchase Details
Closed on
Jan 14, 2025
Sold by
Anzivino Maureen D
Bought by
Mark And Maureen Anzivino Family Trust and Anzivino
Current Estimated Value
Purchase Details
Closed on
Oct 15, 2012
Sold by
Bradley Kathleen M
Bought by
Anzivino Maureen D
Purchase Details
Closed on
Aug 24, 2011
Sold by
Bradley Margaret T
Bought by
Bradley Margaret T and Margaret T Bradley Living Trust
Purchase Details
Closed on
Jul 13, 1994
Sold by
Abadie Carl George and Abadie Roberta Anne
Bought by
Bradley Margaret T
Home Financials for this Owner
Home Financials are based on the most recent Mortgage that was taken out on this home.
Original Mortgage
$100,000
Interest Rate
6.62%
Create a Home Valuation Report for This Property
The Home Valuation Report is an in-depth analysis detailing your home's value as well as a comparison with similar homes in the area
Home Values in the Area
Average Home Value in this Area
Purchase History
| Date | Buyer | Sale Price | Title Company |
|---|---|---|---|
| Mark And Maureen Anzivino Family Trust | -- | None Listed On Document | |
| Anzivino Maureen D | $270,000 | None Available | |
| Anzivino Maureen D | -- | None Available | |
| Bradley Margaret T | -- | None Available | |
| Bradley Margaret T | $223,000 | Continental Lawyers Title Co |
Source: Public Records
Mortgage History
| Date | Status | Borrower | Loan Amount |
|---|---|---|---|
| Previous Owner | Bradley Margaret T | $100,000 |
Source: Public Records
Tax History Compared to Growth
Tax History
| Year | Tax Paid | Tax Assessment Tax Assessment Total Assessment is a certain percentage of the fair market value that is determined by local assessors to be the total taxable value of land and additions on the property. | Land | Improvement |
|---|---|---|---|---|
| 2025 | $4,413 | $374,562 | $279,538 | $95,024 |
| 2024 | $4,413 | $367,218 | $274,057 | $93,161 |
| 2023 | $4,312 | $360,018 | $268,683 | $91,335 |
| 2022 | $4,247 | $352,959 | $263,414 | $89,545 |
| 2021 | $4,170 | $346,039 | $258,249 | $87,790 |
| 2020 | $4,124 | $342,491 | $255,601 | $86,890 |
| 2019 | $4,055 | $335,776 | $250,589 | $85,187 |
| 2018 | $3,966 | $329,193 | $245,676 | $83,517 |
| 2017 | $3,903 | $322,739 | $240,859 | $81,880 |
| 2016 | $3,747 | $316,411 | $236,136 | $80,275 |
| 2015 | $3,690 | $311,659 | $232,589 | $79,070 |
| 2014 | $3,618 | $305,555 | $228,033 | $77,522 |
Source: Public Records
Map
Nearby Homes
- 18321 Fieldbury Ln
- 6161 Norbrook Dr
- 6012 Jasonwood Dr
- 6561 Horseshoe Ln
- 6611 Crista Palma Dr
- 18202 Foss Ln
- 6416 Setting Sun Dr
- 5852 Bellfield Ln
- 5862 Raphael Dr
- 5812 Raphael Dr
- 17231 Lido Ln
- 17982 Whitford Ln
- 18976 Rockinghorse Ln
- 17532 Montbury Cir
- 6600 Warner Ave Unit 50
- 6600 Warner Ave
- 6600 Warner Ave Unit 142
- 6266 Jasmine Dr
- 6662 Brentwood Dr
- 17372 Forbes Ln
- 18051 Clearwater Cir
- 18071 Clearwater Cir
- 18041 Clearwater Cir
- 18081 Clearwater Cir
- 18062 Clearwater Cir
- 18052 Clearwater Cir
- 18072 Clearwater Cir
- 18091 Clearwater Cir
- 18031 Clearwater Cir
- 18042 Clearwater Cir
- 18082 Clearwater Cir
- 18062 Lakepoint Ln
- 18052 Lakepoint Ln
- 18072 Lakepoint Ln
- 18101 Clearwater Cir
- 18092 Clearwater Cir
- 18042 Lakepoint Ln
- 18032 Clearwater Cir
- 18082 Lakepoint Ln
- 18021 Clearwater Cir