
Seller's Agent in 2025
Jonathan Daniels
Equity Union
(818) 501-2253
1 in this area
22 Total Sales
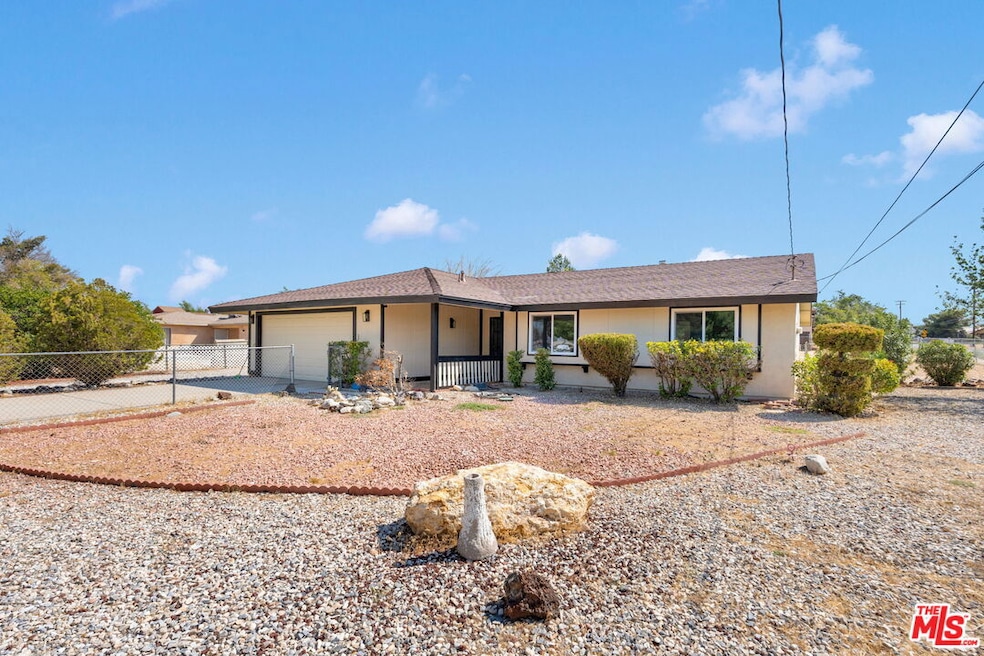


Beautifully updated 3 bed, 2 bath home on a spacious 0.46-acre corner lot in Hesperia with RV parking. Approx. 1,330 sq ft of living space, new HVAC unit, new vinyl flooring, fresh interior and exterior paint, bright recessed lighting throughout the house, quartz countertop, new dual-pane windows, and ceiling fans for year-round comfort. Functional layout with an open kitchen to entertain your guests. Plenty of room for outdoor entertaining, or future expansion. Don't miss this move-in-ready home in a great location!
Last Agent to Sell the Property
Equity Union License #01958320 Listed on: 08/14/2025
Last Buyer's Agent
Alex Morales
LPT Realty, Inc License #02182374
| Date | Type | Sale Price | Title Company |
|---|---|---|---|
| Grant Deed | $435,000 | First American Title | |
| Grant Deed | $320,000 | First American Title | |
| Grant Deed | $71,500 | First American Title Ins Co | |
| Deed | $46,500 | First American Title Ins Co | |
| Trustee Deed | $69,101 | First Southwestern Title Co | |
| Trustee Deed | $6,179 | First American Title Ins Co |
| Date | Status | Loan Amount | Loan Type |
|---|---|---|---|
| Open | $427,121 | FHA | |
| Previous Owner | $296,250 | Construction | |
| Previous Owner | $36,900 | Seller Take Back |
| Date | Event | Price | List to Sale | Price per Sq Ft |
|---|---|---|---|---|
| 11/17/2025 11/17/25 | Sold | $435,000 | +1.2% | $327 / Sq Ft |
| 10/15/2025 10/15/25 | Pending | -- | -- | -- |
| 09/14/2025 09/14/25 | Price Changed | $429,999 | -1.1% | $323 / Sq Ft |
| 09/02/2025 09/02/25 | Price Changed | $434,900 | -0.9% | $327 / Sq Ft |
| 08/14/2025 08/14/25 | For Sale | $439,000 | -- | $330 / Sq Ft |
| Year | Tax Paid | Tax Assessment Tax Assessment Total Assessment is a certain percentage of the fair market value that is determined by local assessors to be the total taxable value of land and additions on the property. | Land | Improvement |
|---|---|---|---|---|
| 2025 | $4,253 | $382,035 | $74,285 | $307,750 |
| 2024 | $1,385 | $114,168 | $15,967 | $98,201 |
| 2023 | $1,219 | $111,929 | $15,654 | $96,275 |
| 2022 | $1,190 | $109,734 | $15,347 | $94,387 |
| 2021 | $1,168 | $107,582 | $15,046 | $92,536 |
| 2020 | $1,154 | $106,479 | $14,892 | $91,587 |
| 2019 | $1,130 | $104,391 | $14,600 | $89,791 |
| 2018 | $1,107 | $102,344 | $14,314 | $88,030 |
| 2017 | $1,087 | $100,337 | $14,033 | $86,304 |
| 2016 | $1,063 | $98,370 | $13,758 | $84,612 |
| 2015 | -- | $96,892 | $13,551 | $83,341 |
| 2014 | $1,034 | $94,994 | $13,286 | $81,708 |
Seller's Agent in 2025
Jonathan Daniels
Equity Union
(818) 501-2253
1 in this area
22 Total Sales
A
Buyer's Agent in 2025
Alex Morales
LPT Realty, Inc
Source: The MLS
MLS Number: 25578823
APN: 0399-153-06
Disclaimer: Certain information contained herein is derived from information provided by parties other than Homes.com. All information provided is deemed reliable, but is not guaranteed to be accurate and should be independently verified.
![]() © 2026 The MLS™ - Combined L.A. Westside MLS (CLAW). All rights reserved. Based on information from The MLS™ - Combined L.A. Westside MLS (CLAW). All data, including all measurements and calculations of area, is obtained from various sources and has not been, and will not be, verified by broker or MLS. All information should be independently reviewed and verified for accuracy. Properties may or may not be listed by the office/agent presenting the information.
© 2026 The MLS™ - Combined L.A. Westside MLS (CLAW). All rights reserved. Based on information from The MLS™ - Combined L.A. Westside MLS (CLAW). All data, including all measurements and calculations of area, is obtained from various sources and has not been, and will not be, verified by broker or MLS. All information should be independently reviewed and verified for accuracy. Properties may or may not be listed by the office/agent presenting the information.
IDX information is provided exclusively for personal, non-commercial use, and may not be used for any purpose other than to identify prospective properties consumers may be interested in purchasing.
Information is deemed reliable but not guaranteed.
Ask me questions while you tour the home.