Estimated Value: $320,000 - $380,000
2
Beds
2
Baths
1,312
Sq Ft
$270/Sq Ft
Est. Value
About This Home
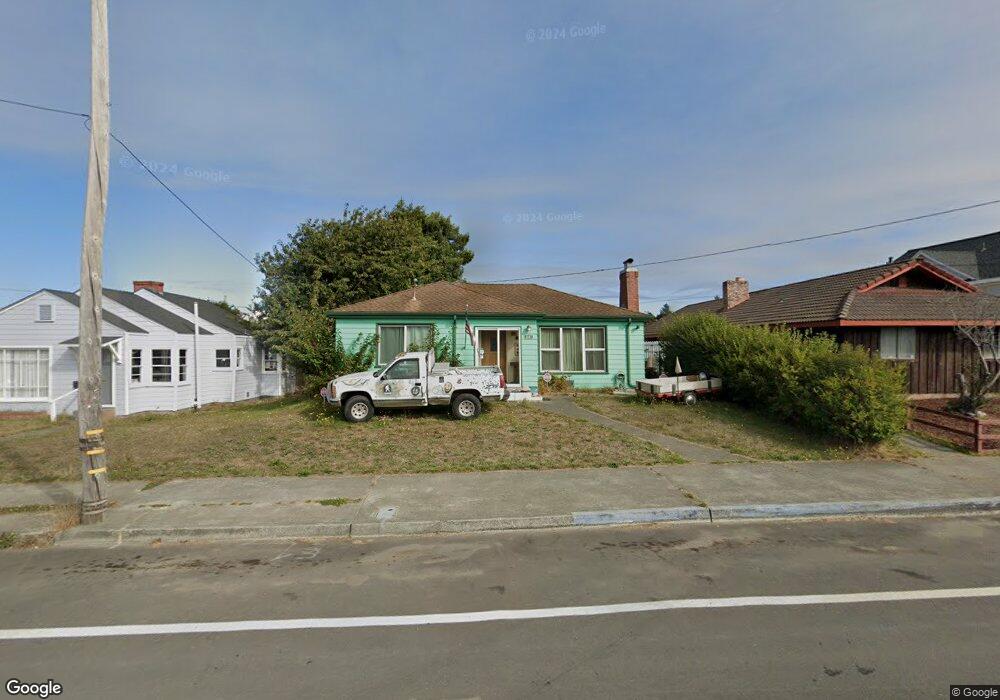
This home is located at 1807 I St, Eureka, CA 95501 and is currently estimated at $354,860, approximately $270 per square foot. 1807 I St is a home located in Humboldt County with nearby schools including Washington Elementary School, Catherine L. Zane Middle School, and Eureka Senior High School.
Ownership History
Date
Name
Owned For
Owner Type
Purchase Details
Closed on
Apr 9, 1998
Sold by
Ratjen Mary Jane
Bought by
Ratjen Alfred E
Current Estimated Value
Home Financials for this Owner
Home Financials are based on the most recent Mortgage that was taken out on this home.
Original Mortgage
$92,168
Outstanding Balance
$17,619
Interest Rate
7.18%
Mortgage Type
FHA
Estimated Equity
$337,241
Purchase Details
Closed on
Sep 8, 1997
Sold by
Killion Robert and Killion Paula
Bought by
Peoples Nancy M
Create a Home Valuation Report for This Property
The Home Valuation Report is an in-depth analysis detailing your home's value as well as a comparison with similar homes in the area
Home Values in the Area
Average Home Value in this Area
Purchase History
| Date | Buyer | Sale Price | Title Company |
|---|---|---|---|
| Ratjen Alfred E | -- | Fidelity National Title Co | |
| Ratjen Edward J | $93,000 | Fidelity National Title Co | |
| Peoples Nancy M | -- | -- |
Source: Public Records
Mortgage History
| Date | Status | Borrower | Loan Amount |
|---|---|---|---|
| Open | Ratjen Edward J | $92,168 |
Source: Public Records
Tax History
| Year | Tax Paid | Tax Assessment Tax Assessment Total Assessment is a certain percentage of the fair market value that is determined by local assessors to be the total taxable value of land and additions on the property. | Land | Improvement |
|---|---|---|---|---|
| 2025 | $1,500 | $153,021 | $63,854 | $89,167 |
| 2024 | $1,500 | $150,021 | $62,602 | $87,419 |
| 2023 | $1,478 | $147,080 | $61,375 | $85,705 |
| 2022 | $1,532 | $144,197 | $60,172 | $84,025 |
| 2021 | $1,434 | $141,371 | $58,993 | $82,378 |
| 2020 | $1,422 | $139,923 | $58,389 | $81,534 |
| 2019 | $1,348 | $133,101 | $57,245 | $75,856 |
| 2018 | $1,326 | $130,492 | $56,123 | $74,369 |
| 2017 | $1,318 | $127,934 | $55,023 | $72,911 |
| 2016 | $1,317 | $125,427 | $53,945 | $71,482 |
| 2015 | $1,304 | $123,544 | $53,135 | $70,409 |
| 2014 | $1,218 | $121,125 | $52,095 | $69,030 |
Source: Public Records
Map
Nearby Homes
Your Personal Tour Guide
Ask me questions while you tour the home.