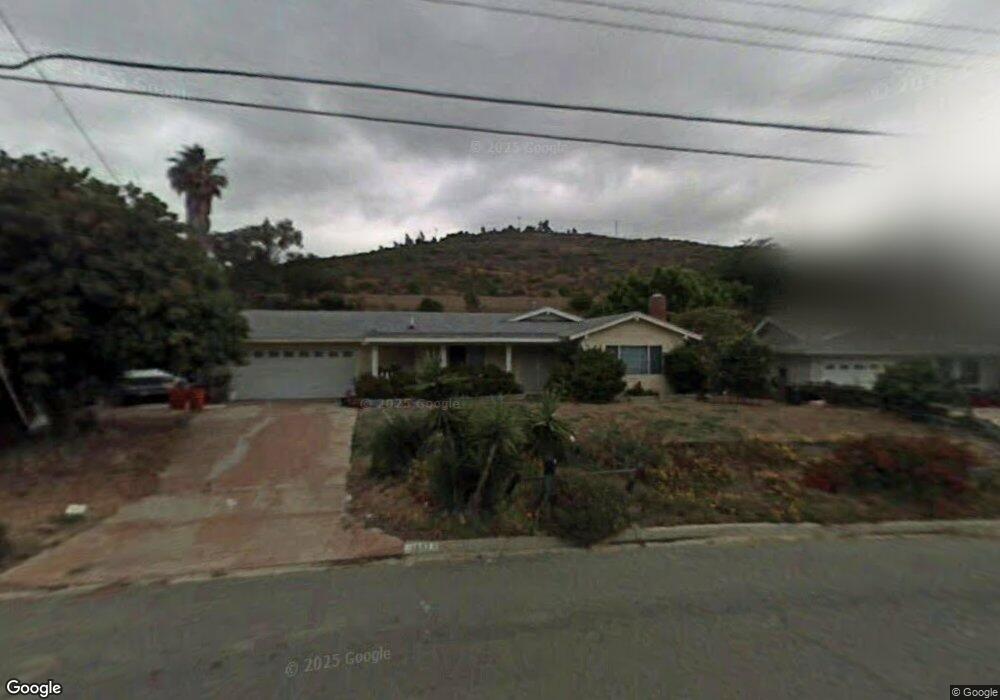
1807 Redwing St San Marcos, CA 92078
Estimated Value: $995,000 - $1,152,000
4
Beds
2
Baths
1,483
Sq Ft
$730/Sq Ft
Est. Value
About This Home
This home is located at 1807 Redwing St, San Marcos, CA 92078 and is currently estimated at $1,083,071, approximately $730 per square foot. 1807 Redwing St is a home located in San Diego County with nearby schools including La Costa Meadows Elementary, San Elijo Middle School, and San Marcos High School.
Ownership History
Date
Name
Owned For
Owner Type
Purchase Details
Closed on
Jul 24, 2000
Sold by
Callanan Morgan W and Callanan Susanne E
Bought by
Benfer Jana L
Current Estimated Value
Home Financials for this Owner
Home Financials are based on the most recent Mortgage that was taken out on this home.
Original Mortgage
$166,000
Outstanding Balance
$59,106
Interest Rate
8.16%
Estimated Equity
$1,023,965
Purchase Details
Closed on
Dec 21, 1994
Sold by
Transamerica Financial Services
Bought by
Callanan Morgan W and Callanan Susanne E
Home Financials for this Owner
Home Financials are based on the most recent Mortgage that was taken out on this home.
Original Mortgage
$141,550
Interest Rate
6.75%
Purchase Details
Closed on
Jun 30, 1994
Sold by
Standard Trust Deed Service Company
Bought by
Transamerica Financial Services
Purchase Details
Closed on
Feb 22, 1994
Sold by
Ramos Henry J
Bought by
Wilshire Canyon Property Inc
Purchase Details
Closed on
Feb 20, 1994
Sold by
Ramos Henry J
Bought by
Shukron Yehudit
Create a Home Valuation Report for This Property
The Home Valuation Report is an in-depth analysis detailing your home's value as well as a comparison with similar homes in the area
Home Values in the Area
Average Home Value in this Area
Purchase History
| Date | Buyer | Sale Price | Title Company |
|---|---|---|---|
| Benfer Jana L | $231,000 | American Title Co | |
| Callanan Morgan W | $149,000 | South Coast Title Co | |
| Transamerica Financial Services | $164,096 | Northern Counties Title Ins | |
| Wilshire Canyon Property Inc | -- | -- | |
| Shukron Yehudit | -- | -- |
Source: Public Records
Mortgage History
| Date | Status | Borrower | Loan Amount |
|---|---|---|---|
| Open | Benfer Jana L | $166,000 | |
| Previous Owner | Callanan Morgan W | $141,550 |
Source: Public Records
Tax History Compared to Growth
Tax History
| Year | Tax Paid | Tax Assessment Tax Assessment Total Assessment is a certain percentage of the fair market value that is determined by local assessors to be the total taxable value of land and additions on the property. | Land | Improvement |
|---|---|---|---|---|
| 2025 | $3,724 | $348,057 | $210,241 | $137,816 |
| 2024 | $3,724 | $341,233 | $206,119 | $135,114 |
| 2023 | $3,653 | $334,543 | $202,078 | $132,465 |
| 2022 | $3,602 | $327,984 | $198,116 | $129,868 |
| 2021 | $3,541 | $321,554 | $194,232 | $127,322 |
| 2020 | $3,507 | $318,258 | $192,241 | $126,017 |
| 2019 | $3,467 | $312,019 | $188,472 | $123,547 |
| 2018 | $3,355 | $305,902 | $184,777 | $121,125 |
| 2017 | $761 | $299,904 | $181,154 | $118,750 |
| 2016 | $3,236 | $294,024 | $177,602 | $116,422 |
| 2015 | $3,188 | $289,609 | $174,935 | $114,674 |
| 2014 | $3,114 | $283,937 | $171,509 | $112,428 |
Source: Public Records
Map
Nearby Homes
- 6691 Corte Eduardo
- 3137 Avenida Topanga
- 6412 Terraza Portico
- 6417 Terraza Portico
- 2196 Coast Ave
- 6267 Via Trato
- 2513 Antlers Way
- 2153 Goya Place
- 2434 Sentinel Ln
- 2930 Rancho Cortes
- 1265 Camino Lorado
- 1263 Via Navajo
- 1219 Via San Jacinto
- 3428 Filoli Cir
- 2092 Silverado St
- 2145 Silverado St
- 1218 Via Apuesto
- 1210 Via Apuesto
- 1299 Via Apuesto
- 1272 Ocean Breeze St
- 1809 Redwing St
- 1805 Redwing St
- 1803 Redwing Way
- 1813 Redwing St
- 1806 Redwing St
- 1810 Redwing St
- 1801 Redwing Way
- 1817 Redwing St
- 1744 Redwing St
- 1745 Redwing St
- 1814 Redwing St
- 1738 Redwing St
- 1818 Redwing St
- 1743 Redwing St
- 1749 Redwing Way
- 1747 Redwing Way
- 1800 Towhee St
- 1732 Redwing St
- 1822 Redwing St
- 1823 Redwing St