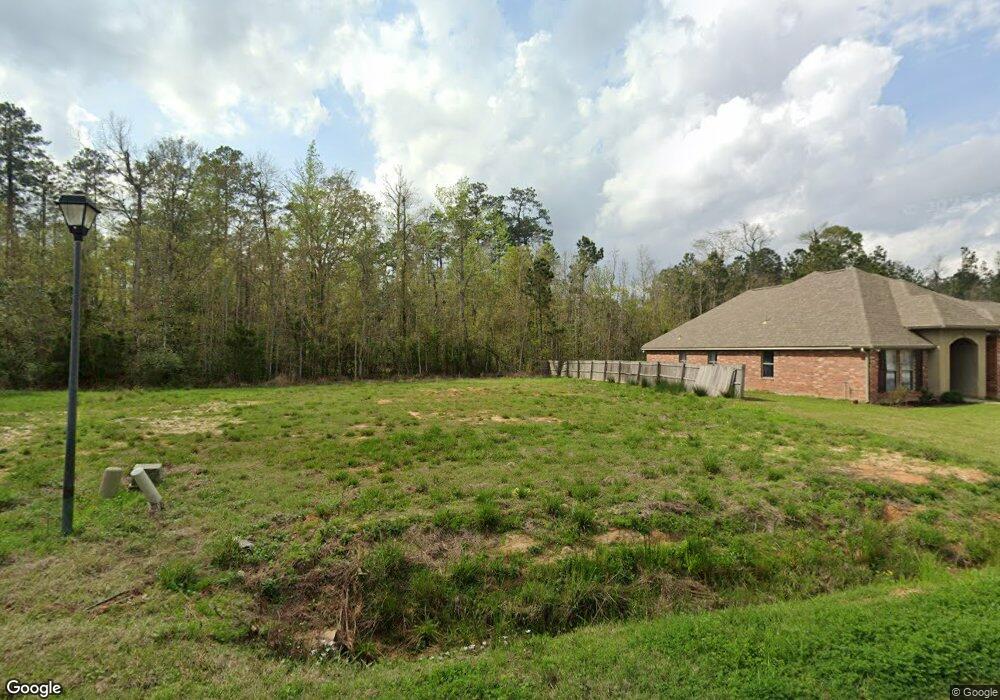
18077 Fox Hollow Loop Other Hammond, LA 70401
Estimated Value: $210,000 - $247,000
3
Beds
2
Baths
1,852
Sq Ft
$125/Sq Ft
Est. Value
About This Home
This home is located at 18077 Fox Hollow Loop Other, Hammond, LA 70401 and is currently estimated at $231,485, approximately $124 per square foot. 18077 Fox Hollow Loop Other is a home located in Tangipahoa Parish with nearby schools including Loranger Elementary School, Loranger Middle School, and Loranger High School.
Ownership History
Date
Name
Owned For
Owner Type
Purchase Details
Closed on
Mar 4, 2016
Sold by
Massey Justin Ronald
Bought by
Whitaker Jason H and Raiford Halie B
Current Estimated Value
Purchase Details
Closed on
Dec 23, 2013
Sold by
Forshag Mark Emile and Lendle Robert Stephen
Bought by
Massey Justin Ronald
Home Financials for this Owner
Home Financials are based on the most recent Mortgage that was taken out on this home.
Original Mortgage
$144,485
Interest Rate
4.36%
Mortgage Type
New Conventional
Purchase Details
Closed on
Apr 25, 2013
Sold by
Whitney Bank
Bought by
Forshag Mark Emile and Lendle Robert Stephen
Home Financials for this Owner
Home Financials are based on the most recent Mortgage that was taken out on this home.
Original Mortgage
$87,975
Interest Rate
3.58%
Mortgage Type
New Conventional
Create a Home Valuation Report for This Property
The Home Valuation Report is an in-depth analysis detailing your home's value as well as a comparison with similar homes in the area
Home Values in the Area
Average Home Value in this Area
Purchase History
| Date | Buyer | Sale Price | Title Company |
|---|---|---|---|
| Whitaker Jason H | $149,900 | None Available | |
| Massey Justin Ronald | $142,000 | Le Fleur De Lis Title Co | |
| Forshag Mark Emile | $73,500 | Taingi Title |
Source: Public Records
Mortgage History
| Date | Status | Borrower | Loan Amount |
|---|---|---|---|
| Previous Owner | Massey Justin Ronald | $144,485 | |
| Previous Owner | Forshag Mark Emile | $87,975 |
Source: Public Records
Tax History Compared to Growth
Tax History
| Year | Tax Paid | Tax Assessment Tax Assessment Total Assessment is a certain percentage of the fair market value that is determined by local assessors to be the total taxable value of land and additions on the property. | Land | Improvement |
|---|---|---|---|---|
| 2024 | $280 | $3,240 | $3,240 | $0 |
| 2023 | $261 | $3,000 | $3,000 | $0 |
| 2022 | $261 | $3,000 | $3,000 | $0 |
| 2021 | $267 | $3,000 | $3,000 | $0 |
| 2020 | $261 | $3,000 | $3,000 | $0 |
| 2019 | $260 | $3,000 | $3,000 | $0 |
| 2018 | $1,395 | $16,019 | $3,000 | $13,019 |
| 2017 | $1,395 | $16,019 | $3,000 | $13,019 |
| 2016 | $713 | $8,181 | $3,000 | $5,181 |
| 2015 | $755 | $16,151 | $3,000 | $13,151 |
| 2014 | $702 | $16,151 | $3,000 | $13,151 |
Source: Public Records
Map
Nearby Homes
- 18092 Fox Hollow Loop
- 18112 Fox Hollow Loop
- 48447 Fox Hollow Blvd
- 48381 Red Fox Dr
- 18181 Fox Hollow Loop
- 0 Fox Hollow Loop
- 18203 Fox Hollow Loop
- 18349 Fox Hollow Loop
- TBD Briarwood Dr
- 0 Alley Ln
- 18240 Faller Rd
- 18064 Faller Rd
- 47450 Morris Rd
- 0 Faller Rd Unit 2485466
- 20467 Cornerstone Rd
- 0 River Road 42 Acres Rd
- 18077 Fox Hollow Loop
- 18083 Fox Hollow Loop
- 18083 Fox Hollow Loop Other
- 18091 Fox Hollow Loop
- 18091 Fox Hollow Loop Other
- 18078 Fox Hollow Loop
- 18084 Fox Hollow Loop Other
- 18084 Fox Hollow Loop
- 18084 Fox Hollow Loop
- 18057 Fox Hollow Loop
- 18057 Fox Hollow Loop Other
- 18098 Fox Hollow Loop
- 18098 Fox Hollow Loop Other
- 18051 Fox Hollow Loop Other
- 18043 Fox Hollow Loop
- 48383 Fox Hollow Blvd
- 48391 Fox Hollow Blvd
- 18051 Fox Hollow Loop
- 18043 Fox Hollow Loop
- 18043 Fox Hollow Loop Other