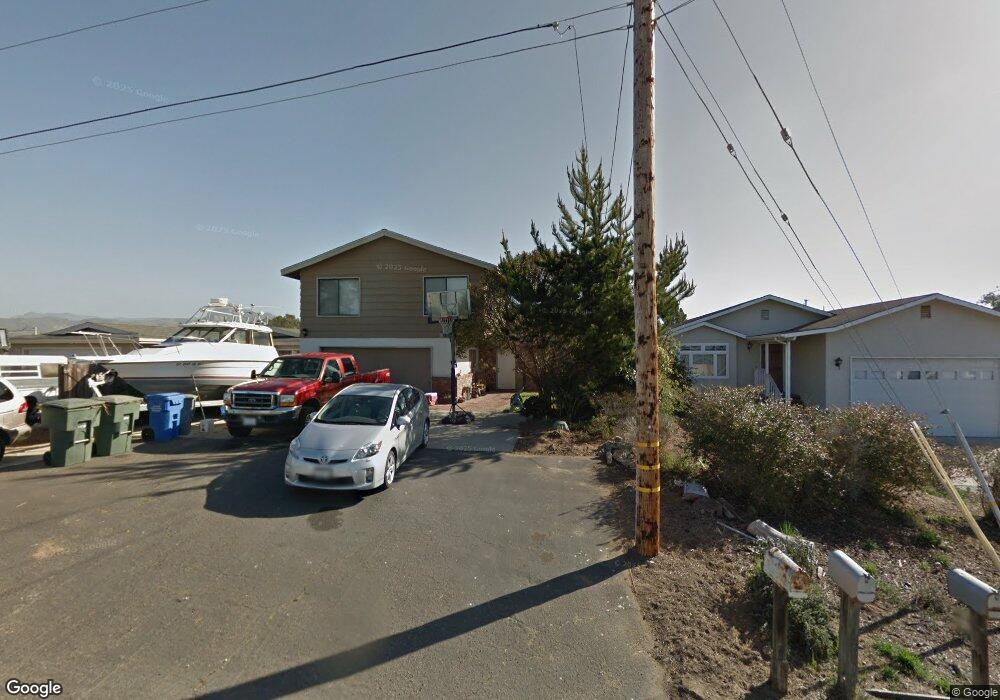
1808 13th St Los Osos, CA 93402
Estimated Value: $977,635 - $1,018,000
4
Beds
3
Baths
1,700
Sq Ft
$586/Sq Ft
Est. Value
About This Home
This home is located at 1808 13th St, Los Osos, CA 93402 and is currently estimated at $995,409, approximately $585 per square foot. 1808 13th St is a home located in San Luis Obispo County with nearby schools including Baywood Elementary School, Los Osos Middle School, and Morro Bay High School.
Ownership History
Date
Name
Owned For
Owner Type
Purchase Details
Closed on
May 20, 2025
Sold by
Marcy Greenblatt Family Trust and Bruton Ken
Bought by
Bruton Greenblatt Family Trust and Bruton
Current Estimated Value
Purchase Details
Closed on
Sep 23, 1997
Sold by
Setting Janice D and Joyce Living Trust
Bought by
Bruton Ken and Greenblatt Marcy
Home Financials for this Owner
Home Financials are based on the most recent Mortgage that was taken out on this home.
Original Mortgage
$100,000
Interest Rate
7.36%
Create a Home Valuation Report for This Property
The Home Valuation Report is an in-depth analysis detailing your home's value as well as a comparison with similar homes in the area
Home Values in the Area
Average Home Value in this Area
Purchase History
| Date | Buyer | Sale Price | Title Company |
|---|---|---|---|
| Bruton Greenblatt Family Trust | -- | None Listed On Document | |
| Bruton Ken | $160,000 | First American Title Ins Co |
Source: Public Records
Mortgage History
| Date | Status | Borrower | Loan Amount |
|---|---|---|---|
| Previous Owner | Bruton Ken | $100,000 | |
| Closed | Bruton Ken | $30,000 |
Source: Public Records
Tax History Compared to Growth
Tax History
| Year | Tax Paid | Tax Assessment Tax Assessment Total Assessment is a certain percentage of the fair market value that is determined by local assessors to be the total taxable value of land and additions on the property. | Land | Improvement |
|---|---|---|---|---|
| 2025 | $5,840 | $292,235 | $95,788 | $196,447 |
| 2024 | $5,635 | $286,506 | $93,910 | $192,596 |
| 2023 | $5,635 | $280,889 | $92,069 | $188,820 |
| 2022 | $5,299 | $275,382 | $90,264 | $185,118 |
| 2021 | $5,196 | $269,984 | $88,495 | $181,489 |
| 2020 | $4,973 | $267,217 | $87,588 | $179,629 |
| 2019 | $4,802 | $261,978 | $85,871 | $176,107 |
| 2018 | $4,864 | $256,842 | $84,188 | $172,654 |
| 2017 | $4,706 | $251,807 | $82,538 | $169,269 |
| 2016 | $3,619 | $246,870 | $80,920 | $165,950 |
| 2015 | $3,578 | $243,163 | $79,705 | $163,458 |
| 2014 | $3,359 | $238,401 | $78,144 | $160,257 |
Source: Public Records
Map
Nearby Homes