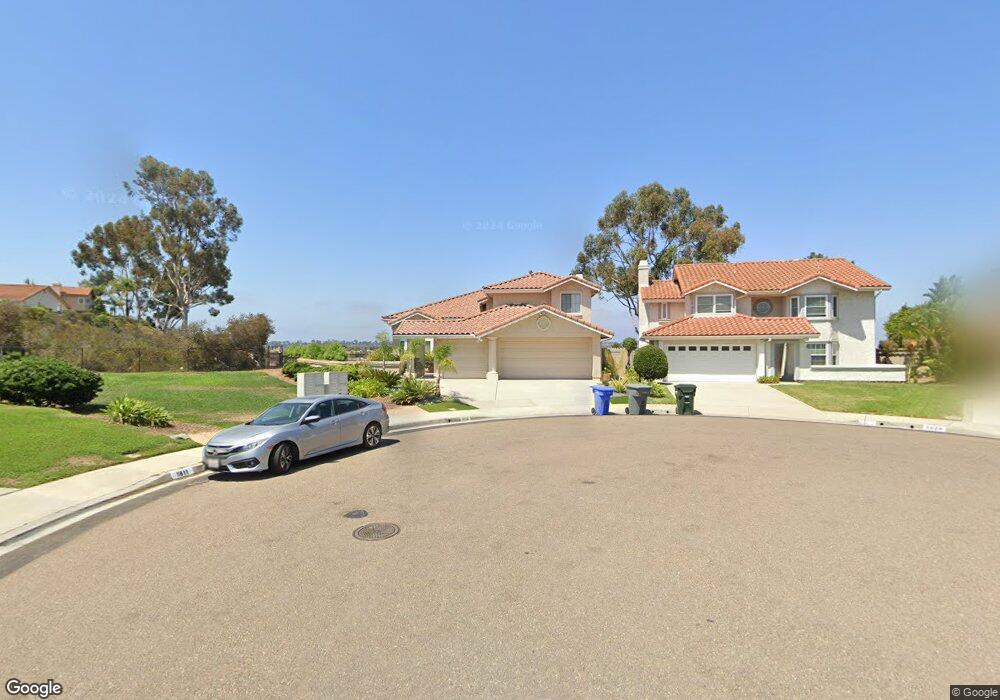
1808 Avenida Josefa Encinitas, CA 92024
Central Encinitas NeighborhoodEstimated Value: $1,942,400 - $2,083,000
4
Beds
3
Baths
2,598
Sq Ft
$779/Sq Ft
Est. Value
About This Home
This home is located at 1808 Avenida Josefa, Encinitas, CA 92024 and is currently estimated at $2,023,850, approximately $779 per square foot. 1808 Avenida Josefa is a home located in San Diego County with nearby schools including Olivenhain Pioneer Elementary, Diegueno Middle School, and La Costa Canyon High School.
Ownership History
Date
Name
Owned For
Owner Type
Purchase Details
Closed on
Jan 18, 2001
Sold by
Vanderbilt Paul E and Vanderbilt Susan M
Bought by
Vanderbilt Paul E and Vanderbilt Susan M
Current Estimated Value
Purchase Details
Closed on
May 4, 1998
Sold by
Holmes Kyle Dean and Holmes Mary Alice
Bought by
Vaderbilt Paul E and Vanderbilt Susan M
Home Financials for this Owner
Home Financials are based on the most recent Mortgage that was taken out on this home.
Original Mortgage
$336,000
Outstanding Balance
$65,824
Interest Rate
7.13%
Estimated Equity
$1,958,026
Purchase Details
Closed on
Nov 30, 1993
Sold by
Mcnellis Terry and Mcnellis Jessica
Bought by
Holmes Kyle Dean and Holmes Mary Alice
Home Financials for this Owner
Home Financials are based on the most recent Mortgage that was taken out on this home.
Original Mortgage
$288,000
Interest Rate
6.98%
Purchase Details
Closed on
Nov 28, 1984
Create a Home Valuation Report for This Property
The Home Valuation Report is an in-depth analysis detailing your home's value as well as a comparison with similar homes in the area
Home Values in the Area
Average Home Value in this Area
Purchase History
| Date | Buyer | Sale Price | Title Company |
|---|---|---|---|
| Vanderbilt Paul E | -- | -- | |
| Vanderbilt Paul E | -- | -- | |
| Vaderbilt Paul E | $420,000 | First American Title | |
| Holmes Kyle Dean | $360,000 | First American Title Company | |
| -- | $205,000 | -- |
Source: Public Records
Mortgage History
| Date | Status | Borrower | Loan Amount |
|---|---|---|---|
| Open | Vaderbilt Paul E | $336,000 | |
| Previous Owner | Holmes Kyle Dean | $288,000 |
Source: Public Records
Tax History
| Year | Tax Paid | Tax Assessment Tax Assessment Total Assessment is a certain percentage of the fair market value that is determined by local assessors to be the total taxable value of land and additions on the property. | Land | Improvement |
|---|---|---|---|---|
| 2025 | $7,522 | $670,618 | $252,690 | $417,928 |
| 2024 | $7,522 | $657,470 | $247,736 | $409,734 |
| 2023 | $7,302 | $644,579 | $242,879 | $401,700 |
| 2022 | $7,123 | $631,941 | $238,117 | $393,824 |
| 2021 | $6,999 | $619,551 | $233,449 | $386,102 |
| 2020 | $6,883 | $613,199 | $231,056 | $382,143 |
| 2019 | $6,746 | $601,176 | $226,526 | $374,650 |
| 2018 | $6,631 | $589,389 | $222,085 | $367,304 |
| 2017 | $6,517 | $577,833 | $217,731 | $360,102 |
| 2016 | $6,317 | $566,504 | $213,462 | $353,042 |
| 2015 | $6,202 | $557,995 | $210,256 | $347,739 |
| 2014 | $6,056 | $547,066 | $206,138 | $340,928 |
Source: Public Records
Map
Nearby Homes
- 1842 Avenida Mimosa
- 1776 Avenida la Posta
- 1990 Avenida la Posta
- 824 Glen Arbor Dr
- 1402 Village View Rd
- 1825 Hummock Ln
- 3224 Avenida la Cima
- 2072 Wandering Rd
- 2801 Jacaranda Ave
- 1105 Catania Ct Unit 201
- 804 & 814 Clark Ave
- 3736 38 Via Rancho Michelle
- 200 202 Neptune Ave
- 772 Conestoga Ct
- 250 258 Hillcrest Dr
- 1080 Primrose Ln
- 1986 Azure Way Unit 107
- 1971 Azure Way
- 2037 Countrywood Way
- 7941 Calle Madrid Unit 4
- 1814 Avenida Josefa
- 1820 Avenida Josefa
- 1811 Avenida Josefa
- 1826 Avenida Josefa
- 1821 Avenida Josefa
- 1832 Avenida Josefa
- 1831 Avenida Josefa
- 1830 Avenida Mimosa
- 1836 Avenida Mimosa
- 1824 Avenida Mimosa
- 1820 Avenida Mimosa
- 1842 Avenida Josefa
- 1819 Avenida Flores
- 1814 Avenida Mimosa
- 1809 Avenida Flores
- 1841 Avenida Josefa
- 1829 Avenida Flores
- 1848 Avenida Mimosa
- 1839 Avenida Flores
- 1808 Avenida Mimosa
Your Personal Tour Guide
Ask me questions while you tour the home.